
What Traders Need to Know About the Stock Price Volatility Index Known as the VIX
Published: Jun 2, 2022, 13:50 UTC
How can the VIX be used?
Daily volatility of the S&P 500 is forecasted by a tool called the VIX, also known as the fear index
The exchange ticker VIX is short for the Chicago Board Options Exchange Volatility Index – also known as the “fear gauge” or the “fear index”.
The VIX is a complex measurement based on trading in S&P 500 (US500) index options. It can be used by equity investors to forecast volatility in share prices. Through a variety of trading instruments, sophisticated investors may also use the VIX as a hedge against losses.
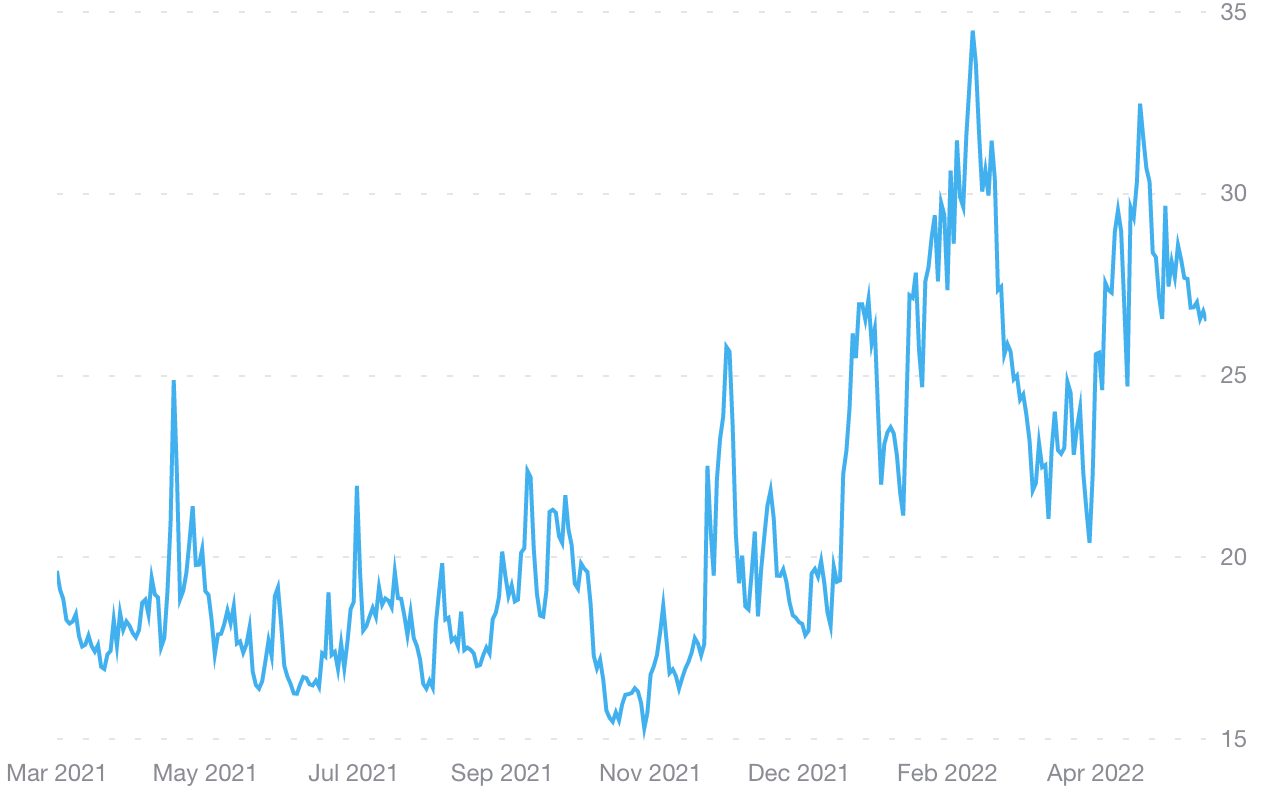
The past few weeks have seen the VIX hover above the value of 20 – a point which is considered to reflect a large amount of market uncertainty and higher than average near-term volatility.
CBOE Volatility Index (VIX) live chart
What is the VIX?
As Piero Cingari, Analyst at Capital.com explains: “The VIX is a forward-looking indicator of expected volatility in the stock market. Specifically, it estimates the projected 30-day volatility of the S&P 500 index by monitoring options prices’ liquidity every day.”
Simply put, the VIX tells us the level of expected volatility for the next 30 days.
So, by observing the VIX, investors can judge the level of risk or uncertainty they can expect in the near term.
The VIX was created by the Chicago Board Options Exchange (CBOE). It is measured using options on the S&P 500, also known as SPX options. Due to the continuous price fluctuations of these options, the VIX is also quite unstable.
How to read the VIX
To make the index more useful, it is best to think of it in levels. Different VIX levels indicate different levels of volatility in the market. Although these levels are not set in stone, they are commonly viewed this way:
VIX 0 to12
Volatility is expected to be low. The last time this occurred was in November 2017.
VIX 13 to 19
Considered a ‘normal’ level of volatility.
VIX over 20
High amount of expected volatility in the market.
VIX over 50
Catastrophic, unexpected events triggering massive uncertainty: the only times this has occurred was during the Global Financial Crisis of 2008 and during 2020 amid the onset of the Covid-19 pandemic
S&P 500 (US500) and VIX (VIX CFD) percentage change over the past six months
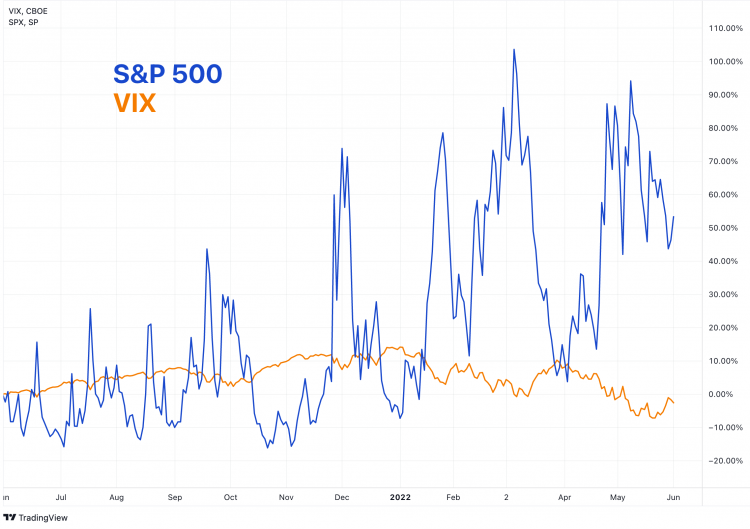
VIX and S&P 500 percentage changes – Credit: TradingView
How can the VIX be used?
1. Forecasting market sentiment
The VIX is one of the most reliable tools for estimating upcoming volatility. This is important for short term traders who want an idea of what to expect in the market for the upcoming 30 days and adjust their investments accordingly. Long-term traders, such as institutional investors, also use the VIX as a guide to whether they need to increase or decrease their hedging positions.
2. Hedging equity investments
The VIX has an inverse relationship with the S&P 500. Historically, the when the S&P 500 declines in value, the VIX increases. This relationship can be used to the traders advantage, by using the VIX to protect against price losses in the equity markets.
3. Can you invest in the VIX?
The VIX is a synthetic measurement, so it is not directly tradable. For more sophisticated traders, there is potential to gain indirect exposure to the VIX via options, futures, CFDs and even ETFs. These trading instruments can be expensive, so novice investors should research them carefully and seek advice.
What the VIX is telling us right now
Cingari says: “The VIX is trading at 28 levels as of the end of May 2022, that is a quite elevated area compared to the 5-year average, which is at about 20.”
Cingari concludes that VIX is likely to remain elevated for some time to come: “Clearly, we’re a long way from the incredible spike in March 2020, but that was a one-off event that resulted in a massive and rapid drain of liquidity from the financial system. However, in a context of rising interest rates, economic (high inflation) and geopolitical (conflict in Ukraine) threats, the VIX might continue to trade above its 5-year average for some time.”
The difference between trading assets and CFDs. The main difference between CFD trading and trading assets, such as commodities and stocks, is that you don’t own the underlying asset when you trade on a CFD. You can still benefit if the market moves in your favour, or make a loss if it moves against you. However, with traditional trading you enter a contract to exchange the legal ownership of the individual shares or the commodities for money, and you own this until you sell it again. CFDs are leveraged products, which means that you only need to deposit a percentage of the full value of the CFD trade in order to open a position.
But with traditional trading, you buy the assets for the full amount. In the UK, there is no stamp duty on CFD trading, but there is when you buy stocks, for example. CFDs attract overnight costs to hold the trades (unless you use 1-1 leverage), which makes them more suited to short-term trading opportunities. Stocks and commodities are more normally bought and held for longer. You might also pay a broker commission or fees when buying and selling assets direct and you’d need somewhere to store them safely.
Capital Com is an execution-only service provider. The material provided on this website is for information purposes only and should not be understood as an investment advice. Any opinion that may be provided on this page does not constitute a recommendation by Capital Com or its agents. We do not make any representations or warranty on the accuracy or completeness of the information that is provided on this page. If you rely on the information on this page then you do so entirely on your own risk.
About the Author
Promotional Contentcontributor
FX Empire provides its readers and partners with this section in order to share the value proposition and products which may be relevant for FX Empire
Did you find this article useful?
Latest news and analysis


Advertisement