


The past month has been pretty extraordinary. But there are signs that the market is starting to act more rationally and waiting on new data to see whether valuations are oversold, or need to be ratcheted down some more.
That’s evident from the fact that the market has not sold off much on days with decidedly bad economic data, like the record 3.3 million weekly unemployment claims March 26, the 6.65 million April 2, and the significant drops in Purchasing Managers’ Indexes (PMIs) now being published. That shows the market has already priced in a lot of bad news. Even a poor upcoming earnings season is now “expected,” although forward-looking comments will be important to some companies and industries.
VIX, volatility and volumes down from highs
Realized five-day volatility hit 150%, more than 10x the level from last year. The 30-day forward looking VIX peaked at 83, also around 5x its “normal” levels last year. Interestingly, options volumes, having spiked early in March, started to fall back to “normal” levels even before volatility peaked.
Chart 1: VIX, volatility and options volumes are well down from their highs
We didn’t quite hit a record volume day, but we got close many times. Average volume for the month of March was 15.6 billion shares. For the month, equities traded $14.6 trillion.
But the fact that all the data points are off their highs seems to indicate that the panic of early March is subsiding (Chart 1).
Chart 2: As volumes fall, the (color) intensity of daily returns has moderated too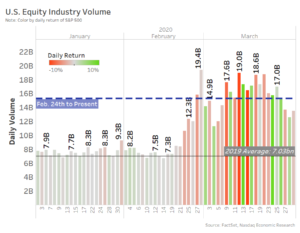
MWCBs seemed to have stemmed bigger losses in single stocks
March saw the new 7% market-wide-circuit-breakers (MWCBs) tested four separate times.
MWCBs are designed to stop all stocks at once, so that negative feedback loops don’t cause a selloff to accelerate. On that basis, the data show the MWCB’s were a success. On the days they triggered, the market generally found support shortly after re-open and traded in an orderly manner for the rest of the day.
It’s important to remember that there are around 8,000 listed stocks in the U.S. That’s a lot of single tickers for market makers to focus on and constantly price right, especially when the whole market is expected to open up or down significantly on near record volumes.
The data on single stock price moves around the MWCBs is promising. It shows that the greater the fall in a stock’s price before the MWCB, the more likely that on re-open the stock price would recover (Chart 3). That seems to show that MWCBs helped to stop worse selloffs in specific companies, allowing investors to find and focus on buying oversold companies on the re-open.
Chart 3: The greater a stock sold off before the MWCB, the more likely it would recover on re-open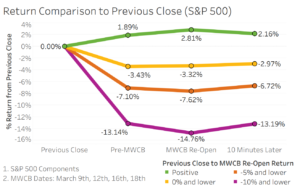
Single Stocks are also hitting guardrails more than normal
Another guardrail exists to protect single stocks too. Known as limit-up-limit-down (LULD), these guardrails are around 5% above and below recently traded prices. That allows an orderly selloff or rally in a stock to occur, but causes a stock to pause when its prices move very quickly.
Not surprisingly, on the days when the market sold off 7% and triggered a MWCB, we saw a spike in single stock LULDs too (Chart 4, yellow bars). Although a deeper analysis shows that often the same stock triggered more than one LULD in the day, the percentage of unique stocks affected was generally 5%-7% of all listed companies, and even less for ETFs.
Chart 4: Single stocks LULD halts have also peaked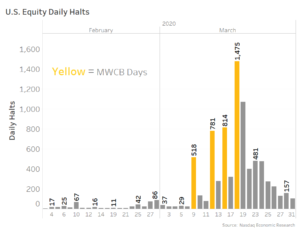
Thankfully, even though single stocks LULD guardrails, at 5% for most liquid stocks, is lower than the 7% market-wide level, they didn’t trigger en masse BEFORE the MWCBs. We discussed recently how that type of result hurt pricing and added to volatility back in Aug 24, 2015.
We see in the data that the number of LULDs, even on non-MWCB days, was increasing through early March. But that too has peaked at 1,475 on March 18, way above the typical average of 11, and has since been falling. That shows that markets are moving less dramatically now than earlier in March.
A deeper dive into the LULDs on specific dates show, consistently, that most happened shortly after the MWCB. We also see than many were limit up (recoveries).
Chart 5: More than half of LULDs were hitting the upper limit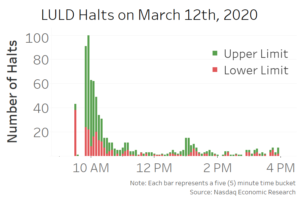
In fact, coming out of the MWCB almost half of stocks had a price reversal of at least 2.5% following the re-open .
Out of the total 22 trading days for the month of March, 17 days had more limit up halts than limit down halts. Looking at all of the 7,845 halts in the month of March, 4,645 were upper halts, with 59% of the halts being upper limit.
Chart 6: Despite the sell-off, March had more Limit Up than Limit Downs
Shorts were restricted by existing Reg SHO rules
After the Credit Crisis, new short sell restrictions were put in place to limit the ability of a short seller to push bid prices lower. Not only do shorts have to locate stock to borrow, so they won’t fail settlements, they also can’t set new lower prices with their trades.
However, lots of research into short selling shows that it removes a valuable source of statistical arbitrage, and liquidity. Spreads widen and liquidity falls, leading to bigger disconnections than normal in related assets. Because of this, short sell restrictions turn on when stocks are selling off, but are not in place all the time.
Data show that the short sell restricted stocks also increased significantly into the middle of March, but have since declined. Despite that, there remain a number of stocks with short sell restrictions in place.
Chart 7: A majority of stocks were Short-sell restricted during the peak of the selloff 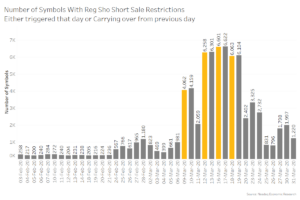
Spreads are up, in line with volatility
When you think about the role of a market maker, the spread represents the return they capture for posting limit orders on both sides of the market. However, when they don’t capture spread, their loss on a buy or sell order is theoretically unlimited. That makes them similar to very short-term options.
Those who have studied how options are valued know that a key input to the Black Scholes formula is volatility (standard deviation of returns). As volatility goes up, the fair option premium also goes up. In fact, it’s so important that many options are priced in “vol” space—you buy 15 “vol” and sell 20 “vol”—and computers tell you what actual option price results.
Given that, it’s not surprising that bid-offer spreads have widened in line with volatility. In fact, it seems to prove that market makers are actually pricing spreads rationally, despite volatile market conditions.
Chart 8: Spreads are wider, but in line with volatility, which is expected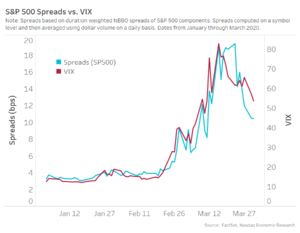
Even the media hype is reducing
Overall, it seems that the level of fear in the market is subsiding. Valuations are still a long way below the peaks from February, but that’s because lost earnings across a wide variety of sectors is being priced in.
Interestingly, data that tracks media and news mentions of COVID-19, and panic generally, are also showing that level of fear and focus peaked mid-March. Data in Chart 9 also shows that the relationship between the media’s focus on COVID-19 seems correlated to sentiment falling. It raises the question: What comes first?
Chart 9: As fear levels rise, confidence falls
Source: Ravenpack
Why is this important?
Circuit breakers have been tested, the liquidity provided has been exceptional, and there are signs that the worst of the storm may have been weathered. In markets like this, spreads should increase, and they have. Even though that raises the costs of trading, it needs to be weighed against how much investors saved from being able to access continuous, transparent and competitive pricing of stocks.
Overall, equity markets globally have performed pretty well, better it would seem than bond markets.
But the level of uncertainty remains is on par with the Credit Crisis, and the market is still pricing in very different scenarios. As more news comes out, our markets can be counted on to react accordingly.
The views represented in this commentary are those of its author and do not reflect the opinion of Traders Magazine, Markets Media Group or its staff. Traders Magazine welcomes reader feedback on this column and on all issues relevant to the institutional trading community.