In recent years at many investment conferences I heard that many public pension plans face underfunding challenges, and they are very interested in investments with strong returns and moderate risk. While past performance is not a guarantee of future results, the Cboe S&P 500 30-Delta BuyWrite Index (BXMDSM) has shown higher returns and lower volatility than the S&P 500®, MSCI EAFE®, and S&P GSCI indexes in the period from its inception in mid-1986 through July 2018.
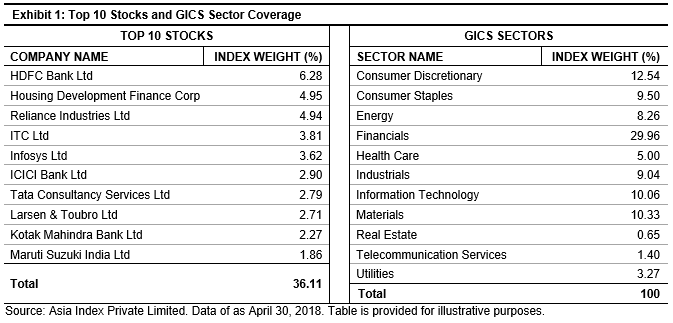
LINE CHART – BXMD INDEX ROSE 2527%
Note in the line chart below that since mid-1986 the BXMD index (which writes out-of-the money (OTM) SPX options) (a) rose 2527%, and (b) generally had bigger upside moves during bull markets than the Cboe S&P 500 BuyWrite Index (BXMSM), (which writes at-the-money (ATM) SPX options).

DESCRIPTION OF BXMD INDEX
The BXMD Index is designed to track the performance of a hypothetical covered call strategy that holds a long position indexed to the S&P 500 Index and sells a monthly out-of-the-money (OTM) S&P 500 Index (SPXSM) call option. The call option written is the strike nearest to the 30-Delta SPX call option at 10:00 a.m. CT on the Roll Date. www.cboe.com/BXMD
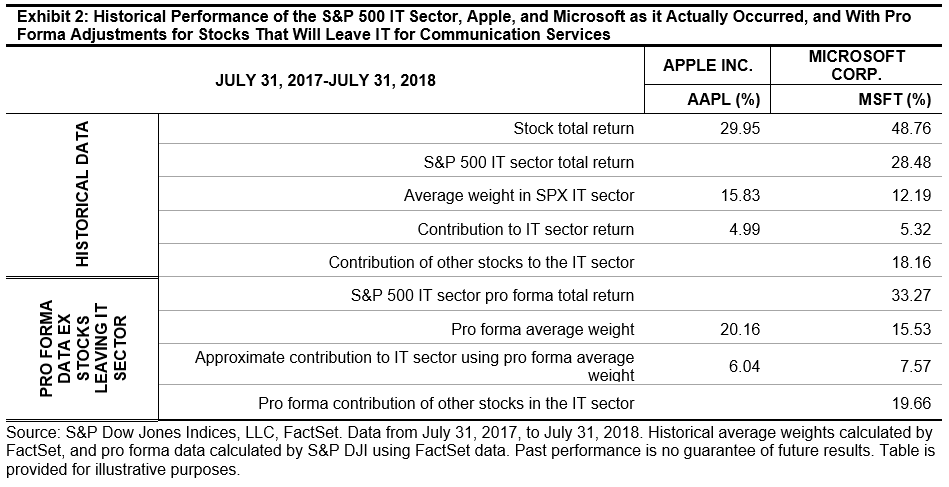
BAR CHARTS – BXMD HAD HIGHEST ANNUALIZED RETURN OF 10.7%
As shown in the two bar charts below, the BXMD Index had the highest annualized returns of the nine indexes shown, and the BXMD also had lower volatility than the S&P 500 and S&P GSCI indexes.

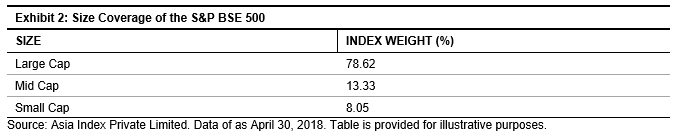
BXMD – LESS LEFT TAIL RISK IN HISTOGRAM
The histogram with the S&P 500 and BXMD indexes shows that the S&P 500 had 13 months with declines of worse than 8 percent, while the BXMD Index had 9 such months. Certain index options strategies can be used to help manage left tail risk.

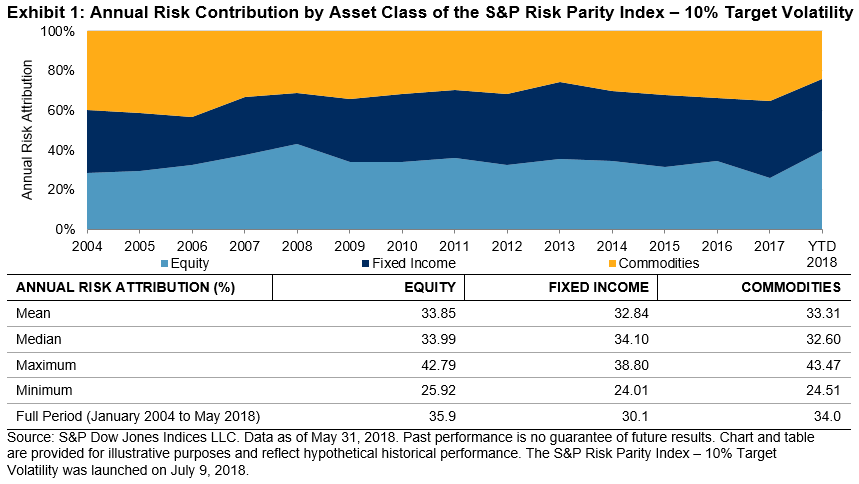
RETURNS AND VOLATILITY CHART – BXMD INDEX IS NORTHWEST OF STOCK AND COMMODITY INDEXES
In the Returns and Volatility chart, the BXMD Index had the highest returns of all 11 indexes, and had lower volatility than the stock and commodity indexes.

TABLE WITH METRICS FOR 12 INDEXES – BXMD HAD HIGHEST RETURN AND HIGH RISK-ADJUSTED RETURN
In the table below with metrics for 12 benchmark indexes:
HIGHEST RETURNS. The BXMD Index had the highest annualized returns;
HIGHER BETA. When compared to the market (the S&P 500), the BXMD Index had a beta of 0.82 and an r-squared of 90.55%; both of these numbers are higher than for most of the other option-based benchmark indexes. A strategy that writes OTM index options has the potential to more closely track its related stock index when compared to a strategy that writes ATM index options. The OTM option writing usually takes in lower premiums than the ATM index option writing strategy, but the OTM strategy can participate in the upside moves in bull markets. The BXMD Index is not designed for diversification and portfolio risk reduction goals.
HIGH RISK-ADJUSTED RETURNS. In the table below, the three indexes with the highest Sharpe Ratios were the Cboe S&P 500 Putwrite Index (PUTSM) (0.687); Cboe S&P 500 Covered Combo Index (CMBOSM) (0.591) and the BXMD Index (0.586). The Sharpe Ratio is one of the most popular metrics for risk-adjusted returns, but a key caveat in use of the Sharpe Ratio is that it works best when comparing investments with normal distributions of returns, but most of the indexes in the table below have non-normal distributions of returns with negative skewness. The skewness over the period of 32+ years was negative 2.14 for the PUT Index, negative 1.11 for the BXMD Index, and negative 0.81 for the S&P 500 Index.

HIGHER RISK-ADJUSTED RETURNS AND THE VOLATILITY RISK PREMIUM
An inquisitive investor might ask – how could the BXMD have higher returns, lower volatility, and higher risk-adjusted returns than several key “traditional” indexes over several decades? One possible explanation for the strong relative performance of the BXMD Index is the volatility risk premium – in recent decades SPX options generally have been richly priced. Exhibit 8 of the paper by Wilshire at www.cboe.com/wilshire shows that S&P 500 implied volatility usually has been higher than subsequent realized volatility, and this has facilitated higher risk-adjusted returns for option-selling indexes such as the BXMD and PUT indexes.
The posts on this blog are opinions, not advice. Please read our Disclaimers.