In my last two articles, I wrote about the equivalence between two popular option positions ? the short put (with no stock position) versus the covered call (long stock and short call). Today we?ll finish that up and talk about out-of-the-ordinary situations.
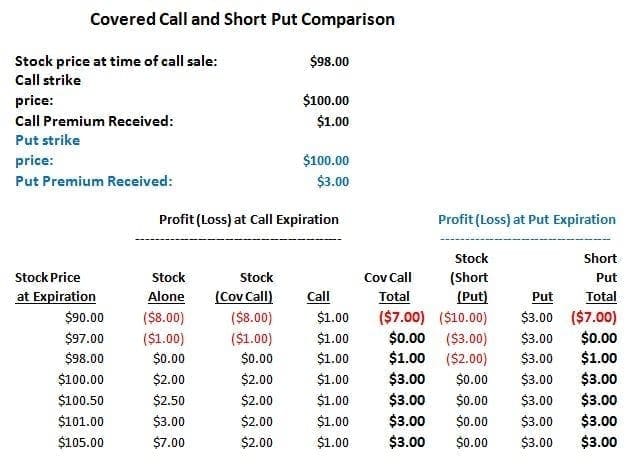
I wrote earlier that you can simulate a covered call position without owning the stock, simply by selling a put option at the same strike. We used a stock selling at $98, and a $100-strike call selling at $1.00. The total out of pocket for that covered call was $98 less $1.00, or $97.00. That ninety-seven dollars was our break-even price as well as our maximum loss. The maximum profit on the position was $3.00, which included a $2.00 profit on the stock ($100 ? $98.00) and the $1.00 premium for the call.
I compared that to a position where we held no stock, but instead held $100 in cash; and sold a put option at the $100 strike price for $3.00. I showed that the short put alone was exactly equivalent to the covered call position, at any price of the underlying. Here is the table comparing the profit/loss of the two positions at selected prices:
 ?
?
The profit or loss on the covered call position is shown in the?Cov Call Total?column, for the selected stock prices at expiration. The P/L for the short put position is in the final column, labeledShort Put Total. In every case, the two values are identical. This is because the amount of time value in the $100 call and the $100 put was the same ? $1.00 for each.
I mentioned that the time value for a call and a put at the same strike was usually close to the same, but not always. Let?s see what happens when it?s not.
As of last Thursday, there appeared to be an unusual situation in the options on QQQ, the NASDAQ 100 Exchange-traded fund. The average implied volatility of the front-month (December) put options was 26%, while for the call options it was only 15%. As one example, with QQQ at $85.47, the $88 strike calls were at thirteen cents. Being out of the money they had no intrinsic value, so all of that $.13 was time value. The $88 puts, meanwhile, were at $3.06. The puts were in the money by ( $88.00 ? 85.47 = $2.53). Subtracting the $2.53 in intrinsic value from their $3.06 price, they had $.53 of time value, or $.40 more time value than the calls at the same strike.
This might make it appear that in this case, holding cash and selling the $88 puts was a much better deal than holding QQQ and selling the $88 calls. Here?s a comparison of the two positions:
??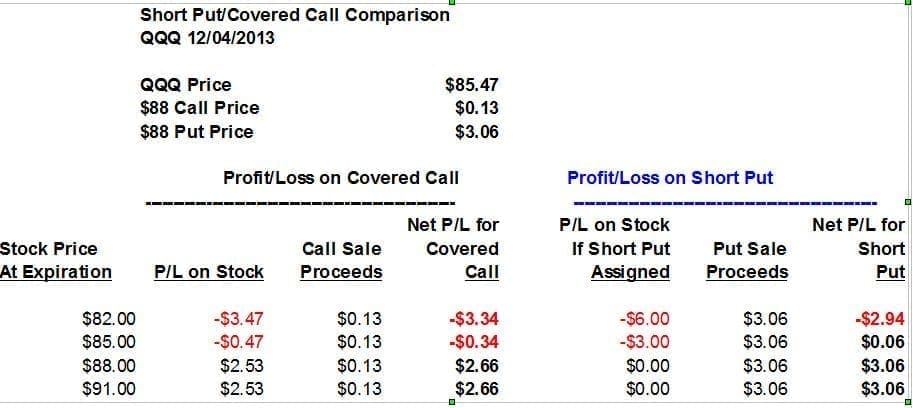
It would seem that in this case the short put is the clear winner. At any stock price at expiration, the?Net P/L for Short Put?shows a value that?s $.40 higher than the?Net P/L for Covered Callcolumn. This $.40 reflects the difference in time value between the put and the call ($.53 for the put vs $.13 for the call).
But there is an additional factor here. QQQ pays a small quarterly dividend, and the ex-dividend date falls before expiration of these options. The covered call investor would receive the dividend (since he would own the stock), while the short put seller would not. Last year?s fourth-quarter dividend was $.366 per share. The $.40 time value difference in this case just reflects the expected dividend.
The moral of the story is that it?s good to keep a sharp eye out for unusual option price or volatility situations, but when they appear we need to make sure we know the full picture. Many situations that might appear at first glance to be anomalies in option prices or volatility may not be when dividends are taken into account.