
This setup has offered multiple profit opportunities in the past, and the volatility index looks to be in a similar situation again, notes Chad Karnes of ETFguide.com.
In March 2013 the Volatility S&P 500 Index (VIX) did something it had not done in over six years. It closed below $12. This six year low in March was accompanied by a new all-time closing high in the market as the S&P (SPX) surpassed its 2007 price high of 1565.
Since then the VIX has seen its fair shares of ups and downs, but interestingly it has yet to reach lower levels than it did back in March. It has also found support numerous times since then, setting up a high probability trade opportunity.
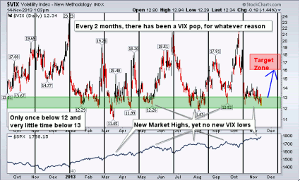
New Market Highs, Yet No New VIX Lows
Even though the S&P has added over 200 points since March’s VIX low of $11.05, the VIX has yet to confirm the market’s rally by making a new low itself.
Typically the VIX falls when the market rallies and rises when the market falls, and generally this is the case and has been the reality over the past year. In technical analysis this is called confirming, which is when two highly correlated assets are behaving as expected confirming one another’s trend.
However, the VIX also typically makes lower lows when the market makes higher highs and makes higher highs as the market makes new lows, and this is something that has not been occurring. In technical analysis this is called diverging, which occurs when two typically highly correlated assets are not confirming one another.
Sometimes the easiest way to view these relationships in action is by looking at price history, which I show and label in the chart below.
Click
to Enlarge
The VIX Setup
In the chart above, there are six major talking points that help us reconcile the VIX’s current trade setup.
1. In March, new six year lows were made on the VIX, which accompanied a new all-time high in the S&P (SPY)—this is what would be expected.
2. In April, May, August, September, and again now in November, new all-time high S&P prices were made, yet the VIX did not make new lows—this is not expected, but presents opportunity.
3. Since the six-year VIX low in March and shown below the green zone, the VIX has yet to close below $12. Support has always come in at $12 or above, keeping risk of loss low.
4. Shown by the green zone, the VIX has also spent very few days in the $12-$13 zone. It usually rallies from this level, also keeping risk of loss low.
5. When the VIX rallies, it usually pops very quickly, often headed to the upper teens just as it did in April, June, September, and October. This helps us identify a profit target.
6. The VIX rallies around every two months as shown by the black vertical lines (40 trading days). The next timing of the VIX rally cycle is mid-December.
The VIX Trade in Action
As you can see, this VIX setup is not new. It has been occurring since March of this year.
Our trade alert was buying the VIX July $13 call options for $370. We sold half that position one month later for an 84% gain as the VIX rallied into the upper teens. We sold the remaining half on 7/5 for another 22% gain.
Again in September, as the VIX crept back toward its support zone, we saw a similar setup, pocketing a 31% gain along with numerous other VIX trades this year captured in our twice weekly Technical Forecast.
This setup has offered multiple profit opportunities and the VIX looks to be in a similar situation now again.
The Two-Month VIX Cycle
Not only has the VIX been a good option to hedge your portfolio when it falls below $13, it has shown to be a reliable two-month cycle as mentioned above, offering speculators excellent opportunity for profits.
That two-month cycle results in another expected VIX pop by mid-December. What just so happens to be coming up in mid-December? The next deadline for US budget negotiations is scheduled for December 13, 2013. Given the VIX’s history, current technical setups, and reliable cyclicality, December again is expected to bring some fireworks to the markets with the VIX in position to benefit the most.
By Chad Karnes of ETFguide.com


