It is undeniable that an individual investor would need considerable skill (or luck) to navigate optimally between the various single-factor equity strategies. If the goal is to outperform the benchmark, then simply choosing between a quality, value, momentum, or low volatility strategy may present the biggest risk. While they all have been shown to hold a unique systematic risk premium that may provide returns over the long term, how can the shorter-term drawdowns of each be avoided? How could an individual investor expect to have the foresight to know which single factor will outperform in the coming years—especially since they all tend to perform differently depending on the market environment and economic cycle?
One solution to this conundrum could be in choosing not to choose. Diversification is often described as the only free lunch in finance, so why not grab a plate and help yourself to a multi-factor buffet? The results are compelling.
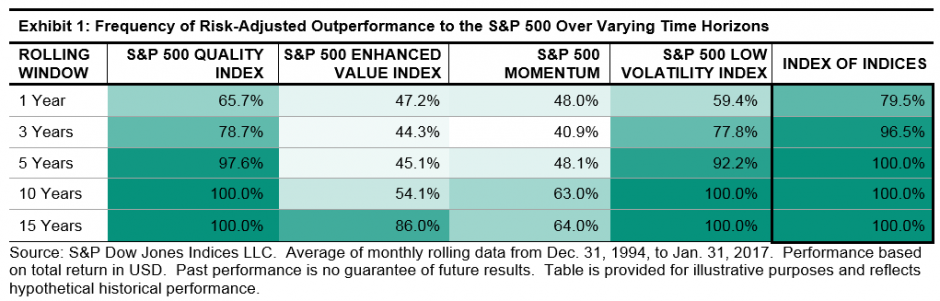
Because the active returns of single-factor strategies often tend to have negative or low correlations, a simple equal-weight allocation to the four key single-factor strategies of the S&P 500® can lead to significantly higher probabilities of outperformance. Using a simple multi-factor “index of indices” approach, we can show that the frequency of risk-adjusted outperformance can be just as good, if not better, than picking the best-performing, single-factor strategy.
If this simple, yet effective, multi-factor index of indices approach is not satisfactory, an investor could decide to go one step further; choosing to combine multiple factor scores at the stock level.
This approach selects the top quintile of the S&P 500 based on the average of its multi-factor scores, targeting stocks that have the highest combination across the desired factors. In practice, some compromises may be necessary; stocks with high exposures to all factors are rare. However, the stock-level approach seeks to select the stocks with highest attainable factor combinations in an attempt to improve the portfolio’s overall factor exposures.

The new S&P 500 Quality, Value & Momentum Multi-Factor Index is an example of this type of stock-level approach. Exhibit 3 shows the average risk/return figures over 15-year rolling windows for both multi-factor approaches and their corresponding single-factor strategies. Take a look at the top-left of Exhibit 3, where the highest returns and lowest risk are represented; you may stop to re-think putting all your eggs in just one single-factor basket.

For a more detailed overview on S&P DJI’s approach to multi-factor indices, please see “The Merits and Methods of Multi-Factor Investing.”
The posts on this blog are opinions, not advice. Please read our Disclaimers.