The story of volatility has been very one-sided of late. There’s been low volatility despite various geopolitical headlines which in the past would have sparked a move lower for the stock market.
So what’s going on? And are there other ways to assess risk for the equity markets?
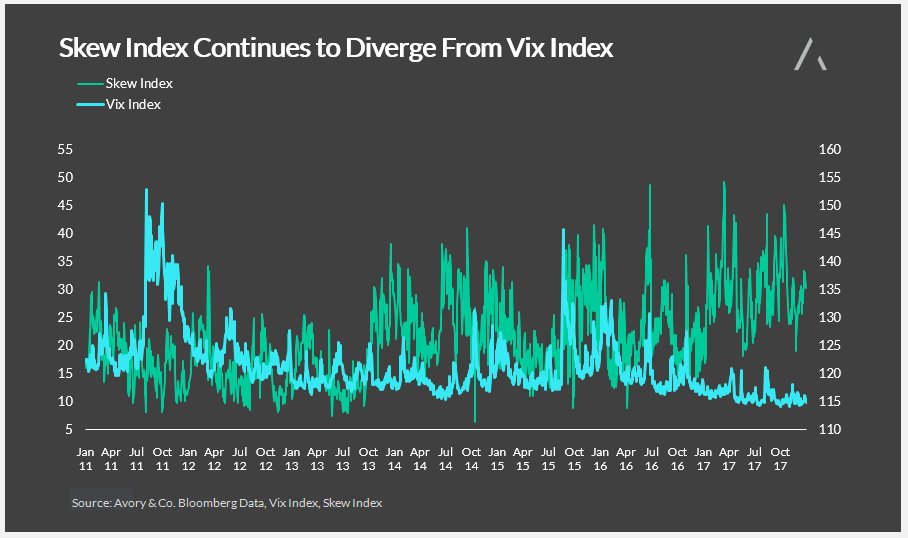
Despite low readings on the CBOE VIX Volatility Index, “black swan” protection is showing up in the CBOE Skew Index. The Skew Index is a good gauge for tail risk hedging.
Since January of 2017 these two indices have moved in opposite directions – a SKEW VIX divergence.
While this has little near-term predictive significance, it does suggest that investors are fine with what is going on today, but believe that the potential for a serious negative event is increasing.
Avoid complacency in early 2018.
SKEW Index vs VIX Index Chart
Thanks for reading.
Twitter: @_SeanDavid
Any opinions expressed herein are solely those of the author, and do not in any way represent the views or opinions of any other person or entity.

 Rolling Over At Key Fibonacci Level?")


 Rolling Over At Key Fibonacci Level?")