AT40 Status: 64.4% of stocks are trading above their respective 40-day moving averages (DMAs)
AT200 Status: 70.1% of stocks are trading above their respective 200DMAs
VIX Status: 12.5 (volatility index)
Short-term Trading Call: neutral
Commentary
Two days ago, I titled my Above the 40 update “The S&P 500 Coiled In Anticipation.” I described the building technical tension that pointed the S&P 500 (via SPDR S&P 500 (NYSE:SPY)) down a runway (really a ladder) going from the bottom to the top of its upper-Bollinger Band (BB) channel. The subsequent jump in the index could not have unfolded any closer to my description. In the wake of President Trump’s address to a joint session of Congress, the S&P 500 gapped up, closed right below its upper-BB, and printed a 1.4% gain for its troubles.
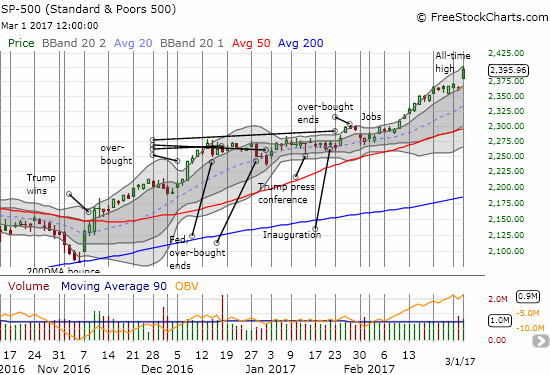
A very bullish breakout for the S&P 500 to yet another all-time high.
The first big move in my pairs trade of long SPDR Gold Shares (NYSE:GLD) versus short iShares 20+ Year Treasury Bond (NASDAQ:TLT) could not have looked any better. GLD gapped down but rallied to close with a minimal 0.1% loss. TLT gapped down and stayed down with a 1.9% loss at the close. Suddenly GLD looks like it could even breakout while leaving TLT further behind. If TLT does not immediately follow-through with more selling, I will likely move to lock in profits on my puts and prepare for the next entry point for the short TLT side of the pairs trade.
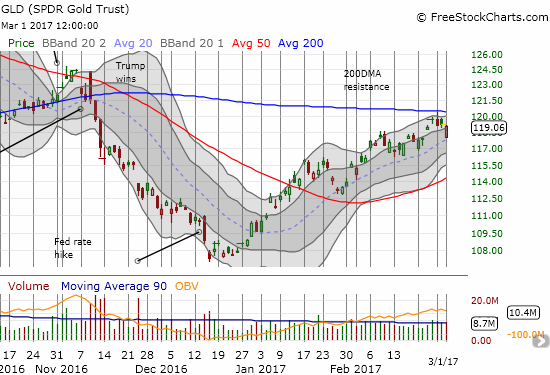
The SPDR Gold Shares (GLD) rallied back from a gap down that would have confirmed a bearish rejection from 200DMA resistance.
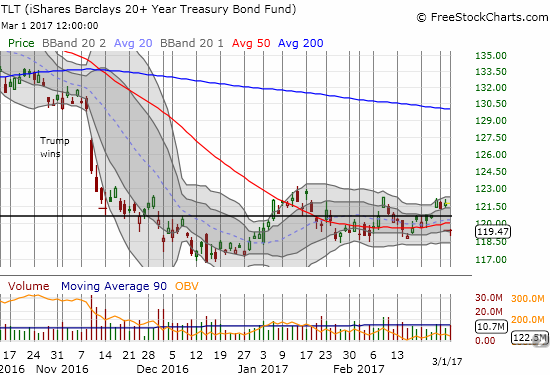
The iShares 20+ Year Treasury Bond (TLT) finds itself below its 50DMA once again. Will it break through the bottom of its recent trading range this time?
The S&P 500’s bullish breakout day FINALLY ended a 55-day streak where the index failed to move 1% in any direction. The last day with a 1% move was December 7th. At that time, the S&P 500 gained 1.3% and broke out to a new all-time high. AT40 ALSO crossed into over-bought territory; the combination of all-time highs and overbought trading conditions is something I expect. After two more days of small gains, the S&P 500 settled into a trading range that included a divergence versus AT40 (T2108). AT40 drifted downward before bottoming in early February. The divergence ended with a brief breakout for AT40 above its downtrend.
Now, a new divergence has emerged. It is milder than the first with the S&P 500 basically rallying away from an AT40 that refuses to budge much. AT40 has failed to return to overbought conditions for 25 straight trading days. At this rate, when (if?) AT40 finally returns to overbought conditions, I will have to give serious consideration to a quick flip to a bearish trading bias. For now, the S&P 500’s breakout raises the trigger for a bearish bias: if the index closes below yesterday’s intraday low at 2359, the red flags will fly.
Overall, I am quite surprised by the inability of buyers to keep AT40 in overbought conditions at the same time the major indices are performing so well. This should be time for an extended overbought rally. Instead, it seems that the market’s appetite has been satiated with the current herd of high performers.
My expectation for a volatility implosion after Trump’s address worked out well for much of the beginning of the trading day. The volatility index, the VIX, gapped down and quickly declined to a 8.8% loss. I took profits on my call option on the ProShares Short VIX Short-Term Futures (NYSE:SVXY), but I decided to hold onto my fistful of put options on the ProShares Ultra VIX Short-Term Futures (NYSE:UVXY) in anticipation of an on-going sell-off.
After the dust settled, the VIX bounced back (is that why GLD roared back?) and closed with a 2.9% loss. The VIX managed to bounce in picture-perfect form off its 50DMA support. Suddenly, the VIX looks like it is building its muscle to remain elevated…rally or no rally.
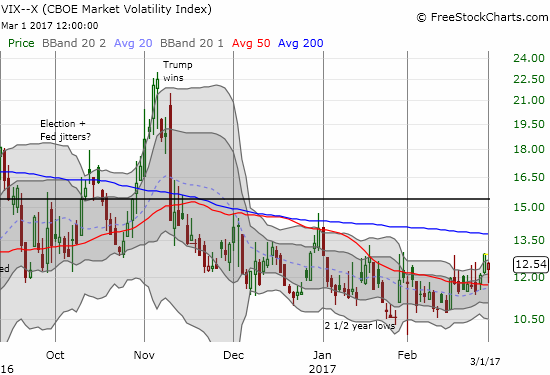
With a picture-perfect bounce of its 50DMA, suddenly, the volatility index looks ready to rally.
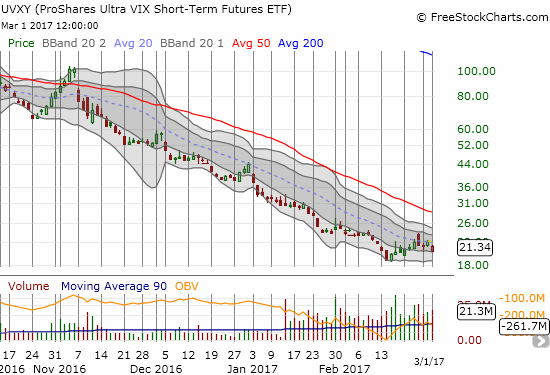
Is the ProShares Ultra VIX Short-Term Futures (UVXY) starting to stabilize?!
It is very possible traders will bid up volatility going into the Fed meeting out of fear that THIS rate hike is the one that deflates the stock market. I highly doubt the Fed will make any single rate hike that causes the market to unravel given it will only hike after the market has prepared well in advance. The Fed prefers that a rate hike happens as a foregone conclusion. So, I look forward to fading volatility around the Fed meeting in what could be the biggest volatility implosion since the November election. In the meantime, I bought a single UVXY call option as a starting hedge to my puts that expire Friday.
The presumed catalyst for these moves was a surge in the 30-day Fed Fund Futures that took the odds of the a March Fed rate hike from 35.4% to 66.4%. New York Fed President William Dudley stoked the expectations in an interview by asserting “…case for monetary tightening has become more compelling.” (from CNBC).
I cannot even remember when last I have seen such a dramatic shift in the odds profile. I now need to quickly shift my thinking to the implications of a market anticipating a rate hike in two weeks. Besides a stronger VIX, one likely implication is a fresh rally in the U.S. dollar index (DXY0) going into the March Fed meeting. The U.S. dollar index ended the day at a new 6-week closing high and broke out from 50DMA resistance.
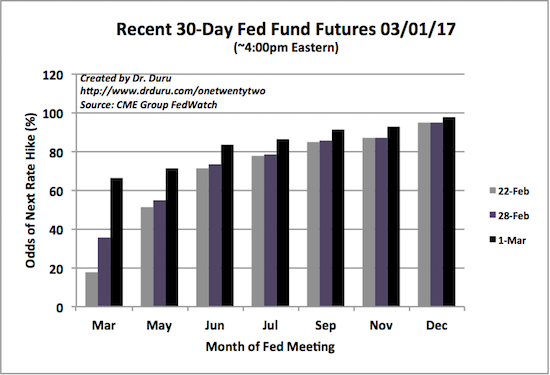
The odds for a March rate hike surged dramatically.
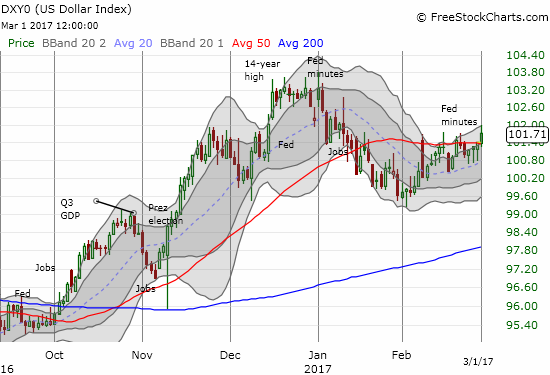
The U.S. dollar index is on the march again ever so slightly.
With the Trump Trade transitioning to the “Trump Volatility,” I am keeping a closer eye on the various setups I have referenced in recent posts. Freeport-McMoran Copper & Gold Inc (NYSE:FCX) triggered today with convincing follow-through to the end of recent selling. I bought call options with an eye to a fresh 50DMA test (at a minimum).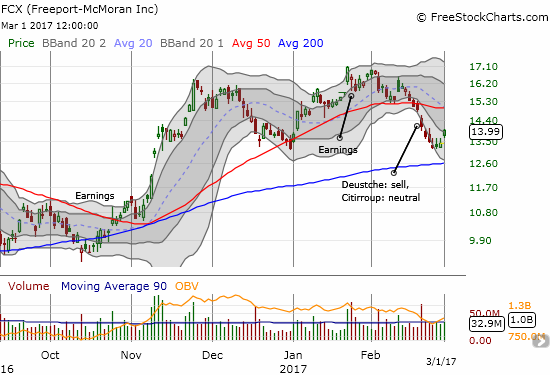
Did Freeport-McMoran (FCX) get “close enough” to a test of support at its 200DMA?
Suddenly cyber-security looks a lot more vulnerable. Palo Alto Networks Inc (NYSE:PANW) was absolutely crushed in a 24.1% post-earnings loss. PANW has struggled to regain momentum ever since its all-time high in the summer of 2015. This collapse pushed PAWN to a new 2+ year closing low. I speculated on a relief bounce with a single call option. Regardless, PANW is starting to look like dead money for a while.
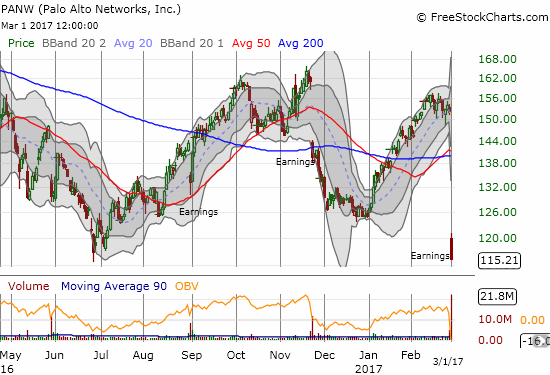
The big post-earnings gap down in November was not enough of a warning for traders and investors. The latest earnings report brought an abrupt end to a sharp 2-month rally that almost closed PANW’s former post-earnings gap down.
Rest In Peace, Paul Kangas! (1937 to 2017)
Kangas “was cool on business TV before business TV was cool….The Walter Conkrite of business news”
What a tumultuous year for Kangas’s retirement. So appropriate that his last broadcast included a review of the year that was: 2009. A review of Kangas over his 30-year run starts at the 16-minute mark. Man – what memories!
“Above the 40” uses the percentage of stocks trading above their respective 40-day moving averages (DMAs) to assess the technical health of the stock market and to identify extremes in market sentiment that are likely to reverse. Abbreviated as AT40, Above the 40 is an alternative label for “T2108” which was created by Worden. Learn more about T2108 on my T2108 Resource Page. AT200, or T2107, measures the percentage of stocks trading above their respective 200DMAs.
Active AT40 (T2108) periods: Day #259 over 20%, Day #79 over 30%, Day #78 over 40%, Day #76 over 50%, Day #1 over 60% (overperiod), Day #25 under 70% (underperiod)
Daily AT40 (T2108)
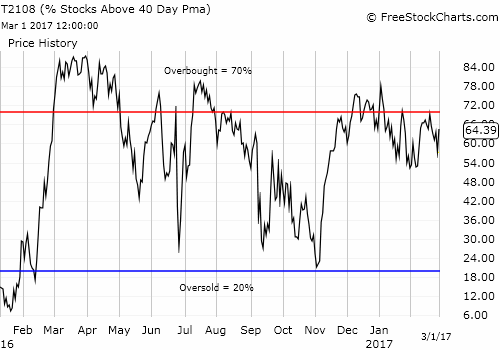
Black line: AT40 (T2108) (% measured on the right)
Red line: Overbought threshold (70%); Blue line: Oversold threshold (20%)
Weekly AT40 (T2108)
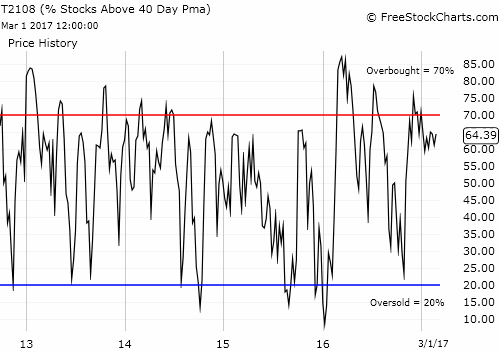
Be careful out there!
Full disclosure: long UVXY put and call options, long FCX shares and call options, long PANW call options, long and short various positions on the U.S. dollar, long GLD shares and call options, long TLT put options
