- CCP disclosures show that total Initial Margin held at CCPs is increasing, mainly driven by increasing IM held by clients.
- We see a steady increase in the number of client accounts at CCPs, which is likely a key driver of Client IM heading higher.
- Compression volumes from the SDRs have hit recent records, and triOptima recently compressed over $25trn in a single quarter!
- This Compression activity helps dealers keep their House IM under control.
- Should IM reduction in the industry now focus on optimising Client IM?
Industry Trends
I was interested to follow Amir’s update on CCP Disclosure data this month. Initial Margin held by dealers at the major CCPs for Rates has started to increase again, after steadily decreasing since June 2016.
And yet, our monthly Swaps Review for September yielded near-record volumes in Compression (and Roll) activity, suggesting that the interbank market is still as focussed as ever in reducing notional – which normally goes hand-in-hand with managing (reducing) IM by eliminating as much noise in the portfolio as possible.
Let’s have a look at some data.
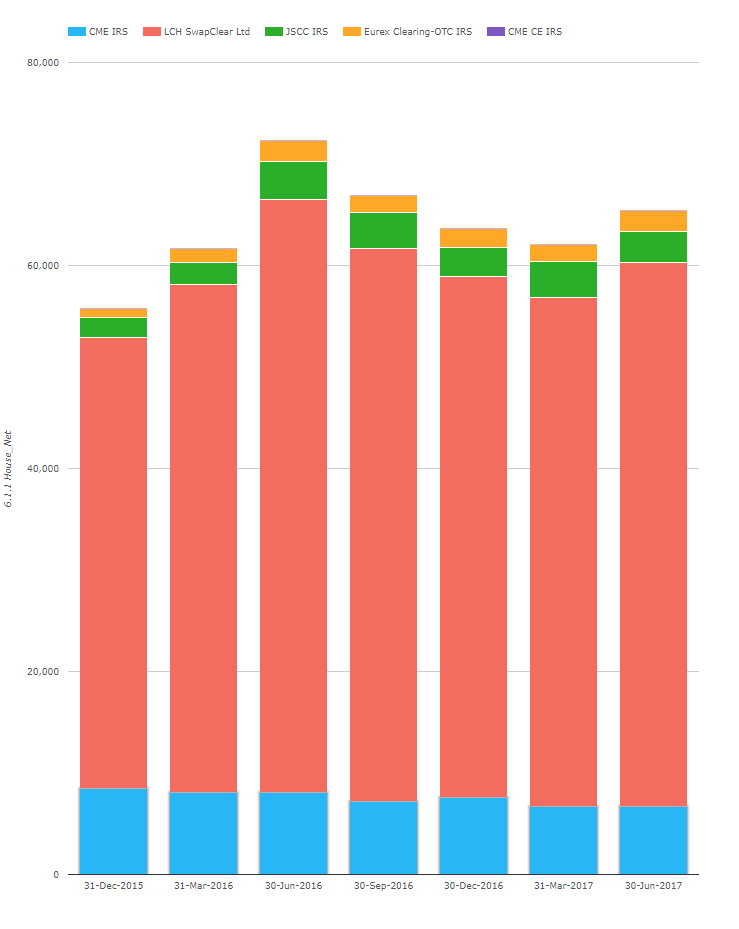
Initial Margin held by dealers at CCPs
We now have data to the end of June 2017 for IM held at CCPs. From CCPView, we see the following House Initial Margin data;
Showing;
- IM held by house accounts for Rates products peaked back in June 2016 (in USD terms).
- This was largely driven by increases at LCH SwapClear.
- IM then gradually declined for House Accounts.
- Some of this has probably been due to a continued weakening in GBP (I believe SwapClear calculates IM in GBP – please correct me if I’m wrong in the comments). Which was somewhat reversed between March and June this year.
- But it is also no-doubt a result of industry efforts on Compression, which can help reduce IM.
I am also aware that expanded clearing mandates should be good for the dealer community in terms of IM management. If more of your clients are forced to clear, more of your balanced risk should exist in clearing, and hence your cleared portfolio should attract lower Initial Margin.
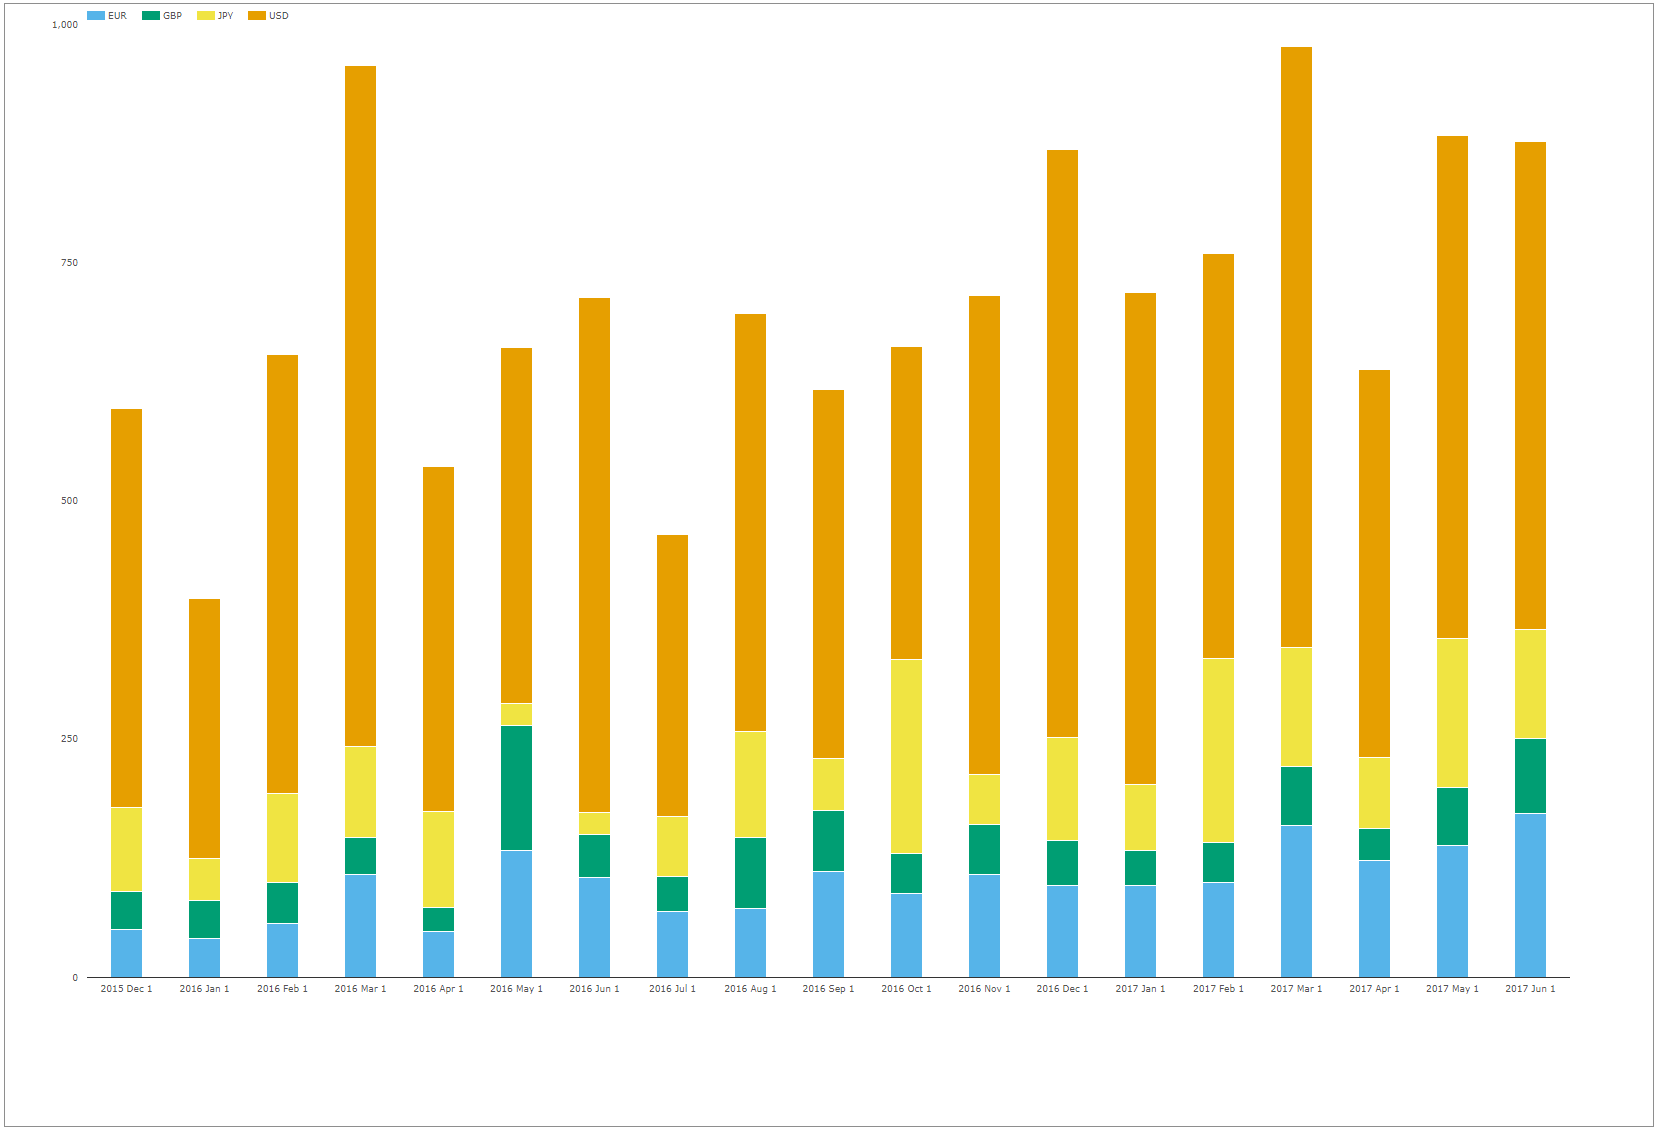
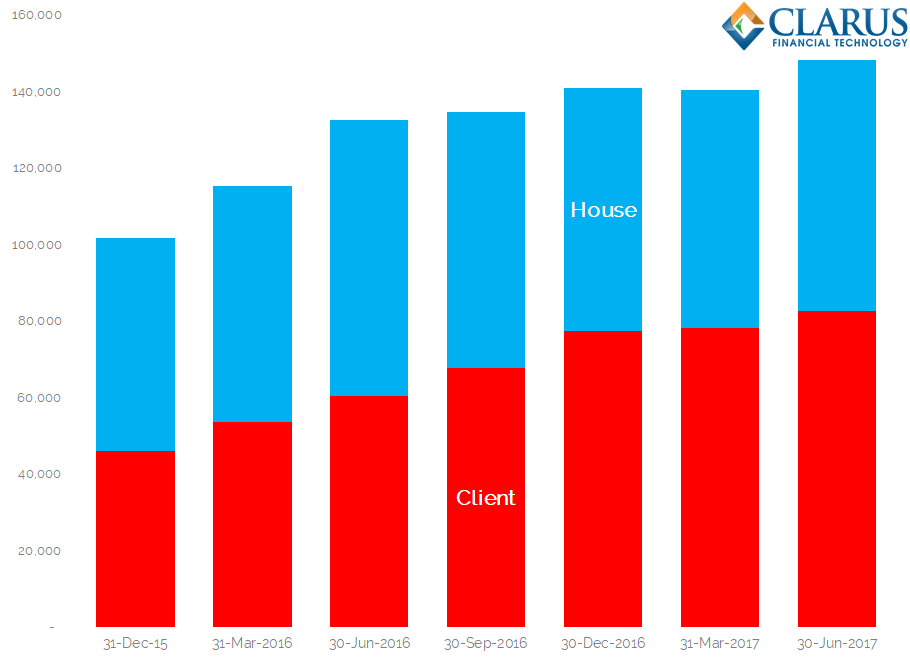
Initial Margin held by Clients at CCPs
With that thought in mind, I expected to see Client IM increasing in Rates. This is indeed what has happened;
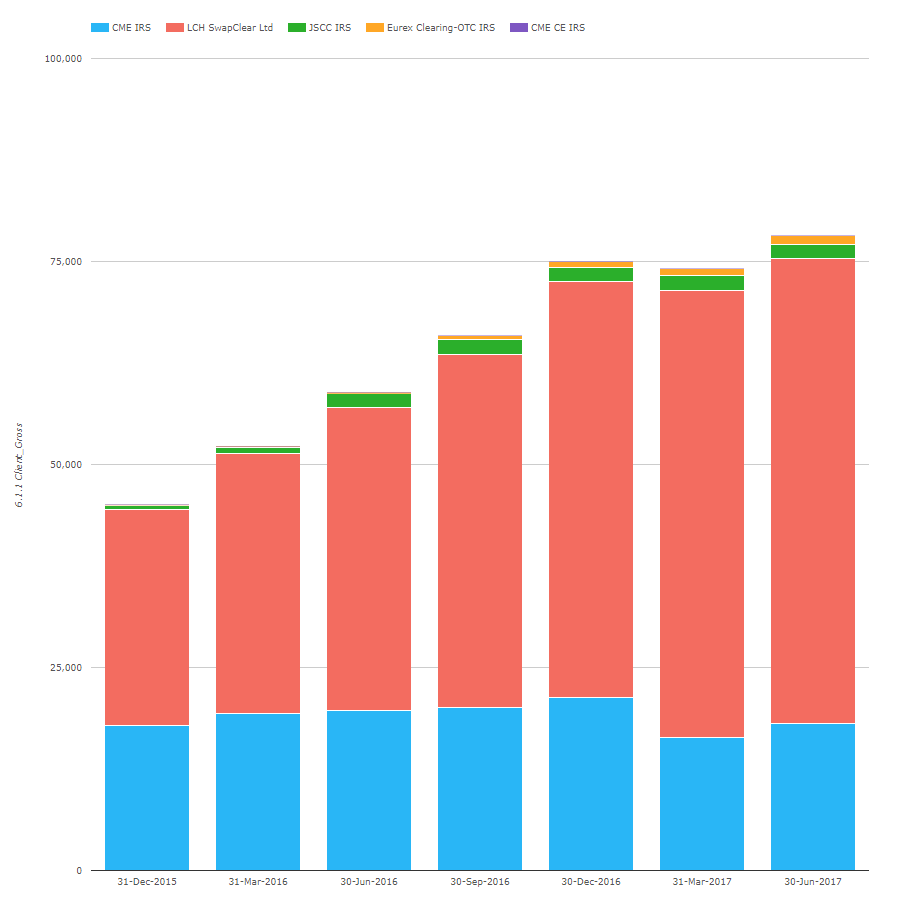
Showing;
- Every quarter, Client IM increased by around 15% until the end of 2016.
- This increase has slowed in 2017 (even registering a dip in March).
This increase is probably due to an ever-increasing number of clients clearing. One of my favourite disclosures is 19.1.1 – Number of Clients:
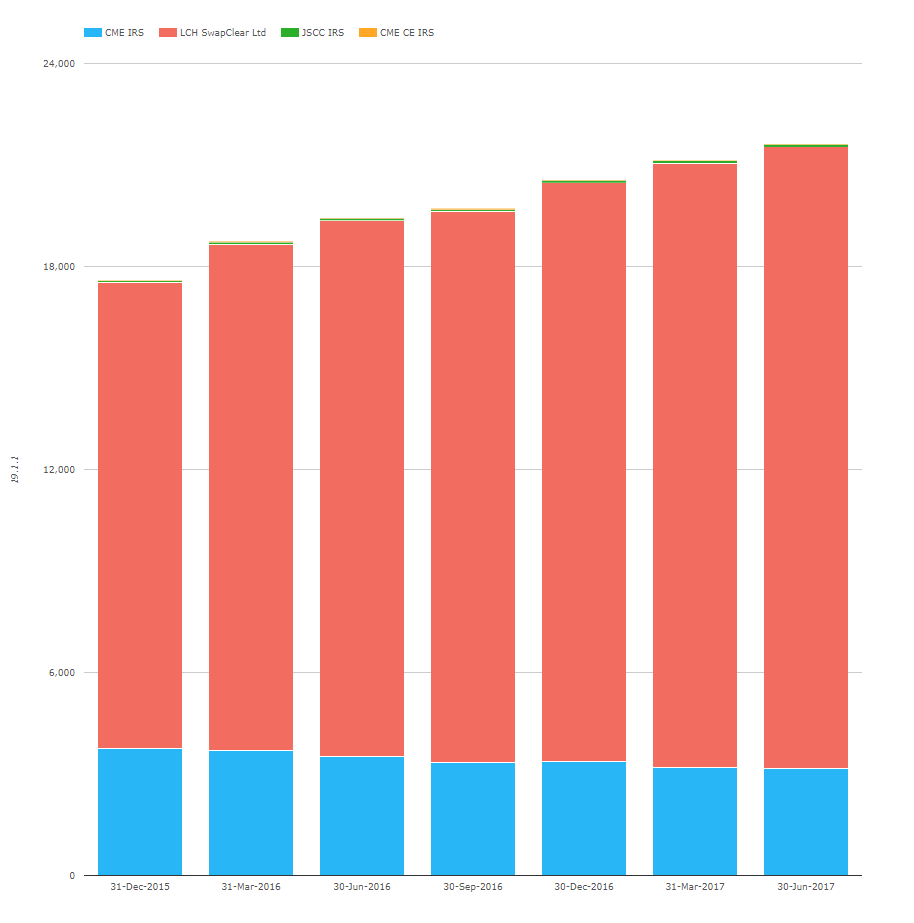
I was really tempted to leave the scale off this chart to see if people can guess how many client accounts there are at SwapClear. But I’ll cut to the chase:
- Since Dec 2015, the number of client accounts at SwapClear has increased from 13,800 to 18,400. Wow!
- The rate of growth has slowed from nearly 10% a quarter to around 4%, but that is still 500 new accounts each quarter. I imagine this is mainly new funds and “sub-funds”, not strictly new clearing participants.
- However, we should bear in mind that ESMA estimated last month that there are 252,000 participants in Rates OTC markets!
A risk neutral book is unlikely
With that data in mind, it would have been nice to show a negative correlation between number of clearing participants and house Initial Margin at SwapClear. The thinking being that the more clients are clearing, the closer a dealer can get to a flat book. Sadly, the exemption for some of the very large derivatives users (Sovereigns and Supras) means this is more than likely a pipe-dream. Certainly, we don’t see that as the case with the data so far:
Showing;
- No real relationship between the number of clients and the amount of House IM being held. The R-squared is 19%.
- A stronger relationship between notional outstanding and house IM. The R-squared is 40%.
Does Compression Reduce Initial Margin?
Given the stronger relationship between notional outstanding and Initial Margin, I thought it worth taking a look at why compression can reduce Initial Margin.
Whilst many would consider Compressing a five-year payer swap versus a 59 month receiver swap as “risk-free”, an Initial Margin model will not. From CHARM, we can see that such a position in $1bn of notional would consume the following amounts of IM:
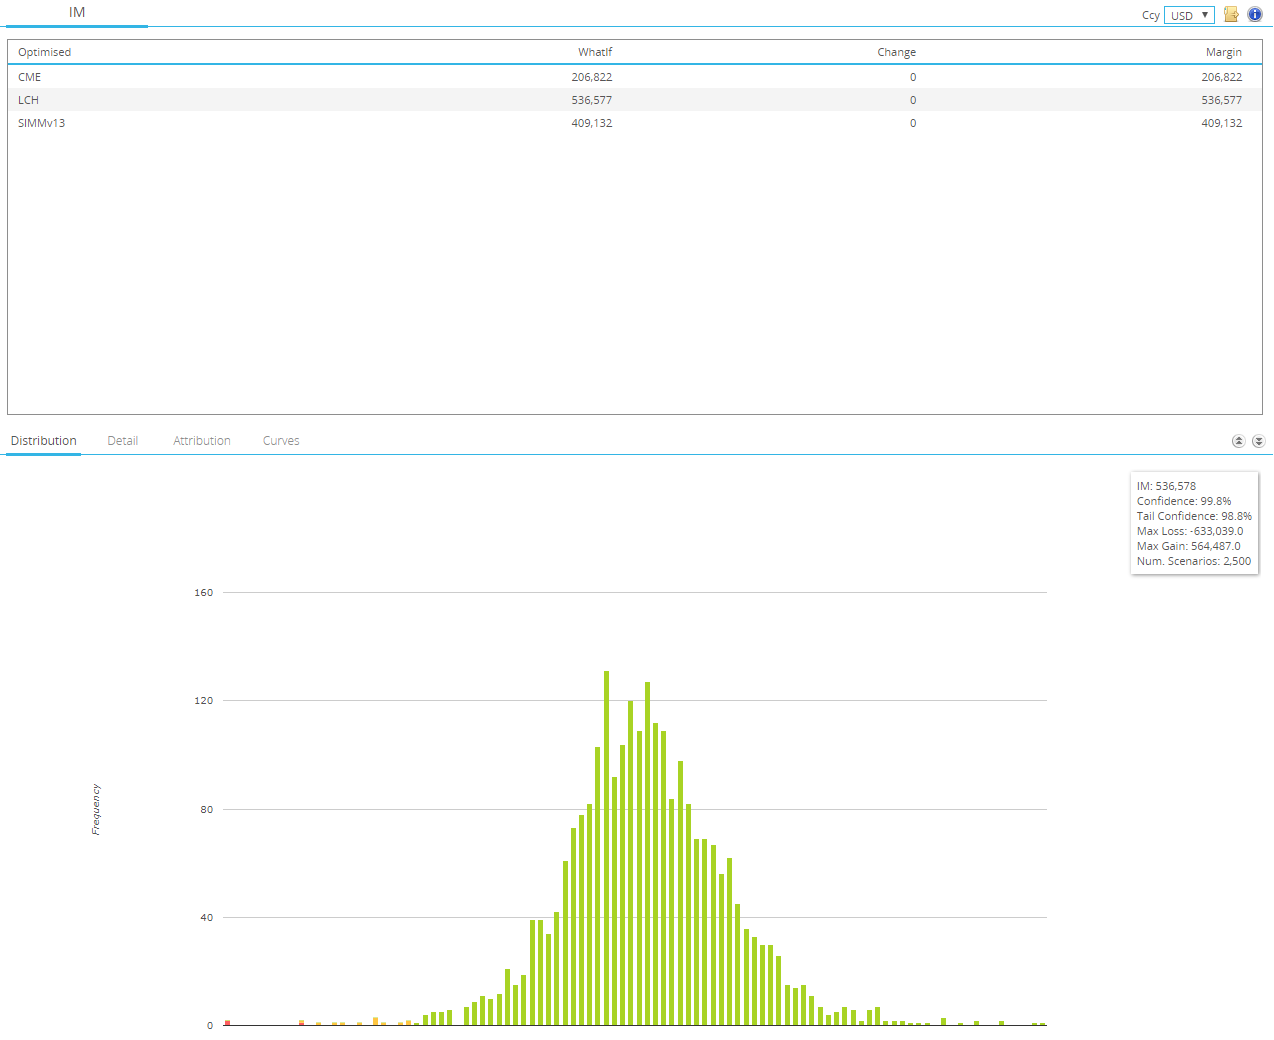
- For a position that is close to risk neutral (~6k DV01), we would have to post $536k at LCH or even $409k under ISDA SIMM.
- The mark to market is only ~$200k, which will be very stable over time.
- It would therefore make sense to terminate this package to release both of the MTM and the IM.
*In a real portfolio, bear in mind that the actual tail events driving IM are unlikely to be driven by this package. This is for illustrative purposes only.
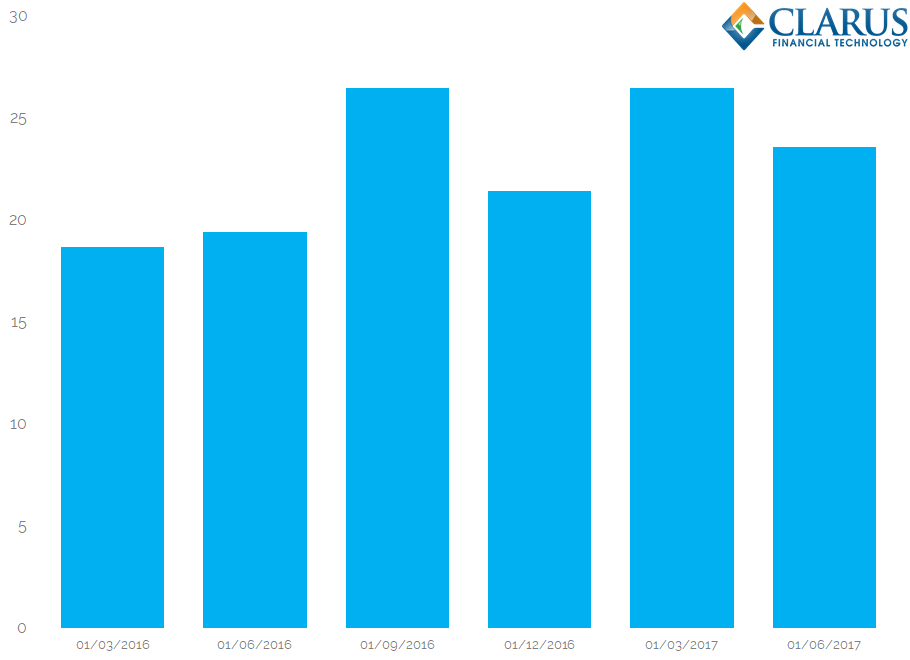
What is Happening in Compression?
We see record volumes in 2017 for Compressions reported in SDR data;
Showing;
- Trades identified by Clarus as Compression, Roll or List traded activity in SDR data since December 2015.
- May and June 2017 were both close to record months.
- As Amir reported, volumes have continued to increase since then.
- Much of this Compression activity will have been transacted across D2C SEFs and hence be reflected in changes in Client IM at CCPs.
We also reached out to triOptima for some volume data for their triReduce service. These volumes are more representative of compression activity across the market as a whole. They have seen very large volumes in 2017;
Showing;
- In SDR data, we see less than $3trn each quarter in notional compressed. We could probably double that if we looked at OIS data as well.
- TriOptima, however, compress between $19trn and $26trn each and every quarter. That is impressive stuff, and at least three times what we see reported in SDRs.
- This sheer amount of activity must be keeping a lid on Initial Margin held by dealers at CCPs, removing some of the noise on portfolios.
Optimisation
These huge volumes got me thinking. Compressing up to $30trn per quarter (across TriOptima and SDR figures) achieves a near stand-still in dealer IM, but Client IM is still increasing. Are current Compression methodologies reaching their limits of what is possible? To reduce IM further, will dealers have to be comfortable with either larger risk tolerances on a multilateral run, or look at new methods?
I’m sure that is what both Quantile and the triOptima triBalance services are looking at.
CHARM also allows you to optimise portfolios. For example, Clients can optimise across their FCMs by porting trades and hence minimising Initial Margin. For example, a sample portfolio could reduce IM by simply moving ten trades:
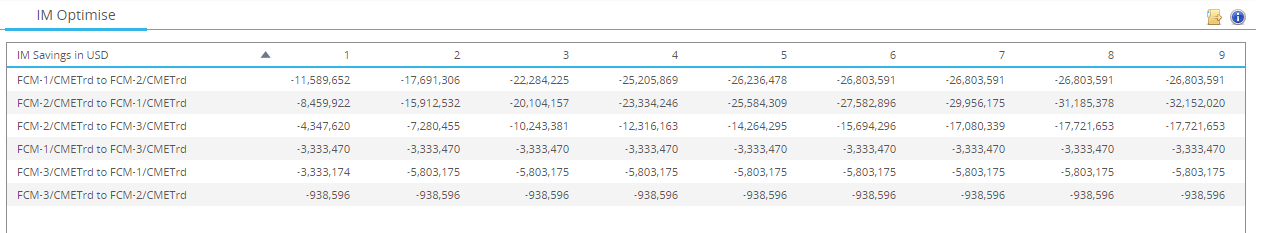
We won’t go into the secret sauce of our optimisation – but suffice to say we can run this across cleared and uncleared portfolios for when you consider backloading or cross-counterparty optimisation as well. We have covered examples here and here.
Afterall, when you consider the recent changes in IM, it is the Client portfolios that need to start optimising. What better way than risk-free porting of pre-existing risk?
Contact us to see how CHARM can optimise your portfolio.