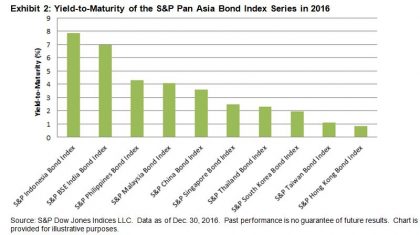
The S&P Pan Asia Bond Index, which seeks to track local currency bonds in 10 countries and is calculated in USD, continued to be weighed down by the weakness of local currencies in 2016, dropping 1.86% for the year. Meanwhile, its yield-to-maturity widened 38 bps to 3.75% YTD. Reversing the trend seen in 2015, the S&P Pan Asia Government Bond Index was down by 1.33% in 2016, still outperforming the S&P Pan Asia Corporate Bond Index, which fell 3.11% over the same period. The size of Asia’s local currency bond markets, as measured by the S&P Pan Asia Bond Index, gained 20% to reach USD 10.3 trillion in 2016, reflecting steady market expansion.
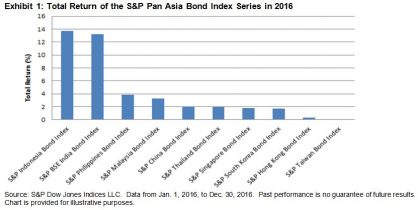
The 10 country-level bond indices calculated in local currencies all ended the year with positive total returns. The three outperforming countries within the S&P Pan Asia Bond Index were Indonesia, India, and the Philippines. The S&P Indonesia Bond Index increased 13.71% in 2016, while its yield-to-maturity tightened 16 bps to 7.87%, making Indonesia the best-performing country in Pan Asia for the year. The S&P BSE India Bond Index gained 13.22% YTD, and its yield-to-maturity widened 38 bps to 6.94%. The S&P Philippines Bond Index added 3.82% YTD, while its yield-to-maturity tightened 7 bps to 4.28%—a strong rally that flipped this market from among the three worst-performing countries in 2015 to one of the three top performers in 2016.
The S&P China Bond Index was up 2.06% in 2016, lagging other countries and its own 2015 return of 8.05%. Nevertheless, China’s bond market showed sustained growth. The market value, as tracked by the S&P China Bond Index, increased 38% to RMB 49 trillion in 2016. Among the sector-level subindices, the S&P China Provincial Bond Index almost tripled its size to RMB 9.5 trillion, while the S&P China Financials Bond Index expanded by 80% in 2016.