Markets dislike uncertainty. However, October is historically a volatile month, with the CBOE Volatility Index (VIX) averaging 22.26 in the past decade. In addition, the US presidential election is just one month away. Should investors choose risk-on or risk-off? One way to help answer that question is to dissect the stock market pattern for election years.

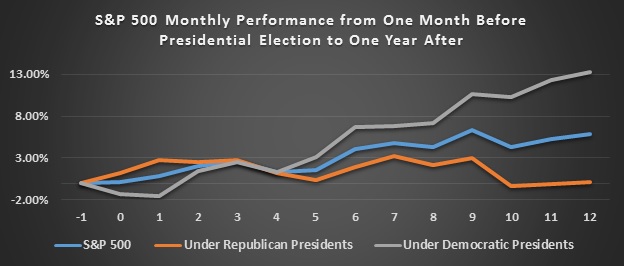
Figure 1. S&P 500 monthly performance from one month before presidential election to one year after
Even though the market tends to be somewhat volatile in October, since 1950 the general trend has been quite flat in the month leading up to Election Day, with the exception of 2008. Not only do investors wait for the election results, they also seek to confirm upcoming policy changes before making investment decisions, as reflected by the 6-12–month post-election performance of the stock market. This observation is supported by the “presidential puzzle”: excess returns in the stock market are higher under Democratic than Republican presidents. Some academic literature argues that this is due to the business cycle – GDP growth is slower during Republican presidential mandates. Also, following the recent presidential debate, the stock market reacted positively to the performance of the Democratic candidate.
Importantly, before we jump to the conclusion that a Democratic presidential outcome would benefit investors in the long run, we should be aware that expected returns under Republicans are actually higher than under Democrats. This suggests that the stock market may not fully price in the risks associated with Democratic policies and tends to be surprised to the upside ex post. If the indication of more risks under Democrats is correct, then investors should also prepare for more volatility.

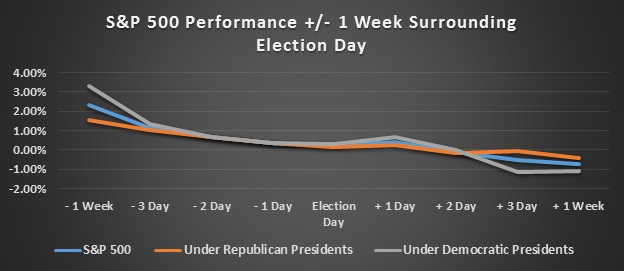
Figure 2. S&P 500 performance +/-1 week surrounding election day
Shifting our focus to the short term, we find that the 1-week window surrounding Election Day provides some potential opportunity. The 1-week return prior to Election Day is significantly higher when the election goes to the Democrats. The average return is over 2.3% during the 5-day period. The pattern appears consistent with the old saying “Buy the rumor, sell the fact.” From a behavioral perspective, event trading usually does not occur until a few days before the event; as the actual voting day approaches, the event premium disappears.
Will this time be different? We shall find out soon.
