![]() TheoTrade Analysis Team
TheoTrade Analysis Team
TheoTrade, LLC
Traders Don’t Care About Protection
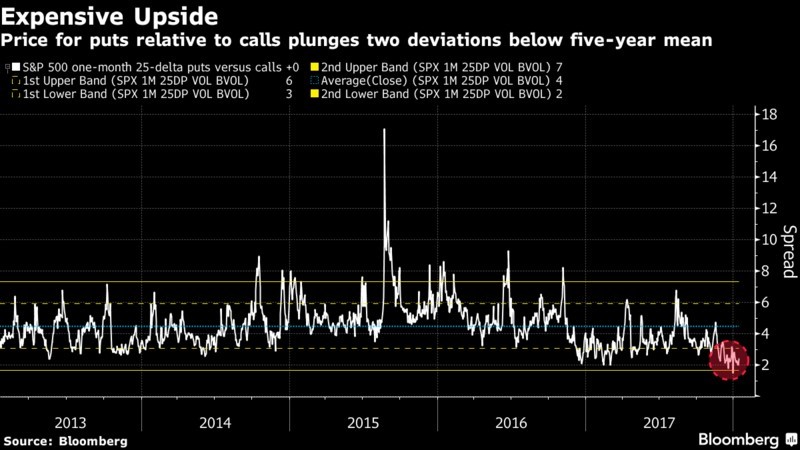
The price of the puts compared to calls is 2 standard deviations below the 5 year average as you can see in the chart below. You would think with stocks going up in a straight line, investors would seek to buy protection to lock in their gains. However, euphoria makes investors care less about the downside; stocks haven’t had a 5% correction in almost 400 trading days. Secondly, put buying gets expensive if you must keep rolling it over and it never ends up being worth anything. It’s like buying an expensive back up oxygen tank when you go in a submarine (assuming you need to buy a new one every time you go in it). Shorting the VIX, selling puts, and buying calls have been trades that have worked for a while.
On the other hand, when the indicator below saw put prices increase versus calls, it was a good time to buy stocks. It’s like buying stocks when the VIX goes up or buying the dip in stocks. This indicator is screaming to sell stocks like many other near term trading indicators, but we haven’t seen them accurately predict a sell off in a while.
Using RSI To Predict The End Of Bubbles
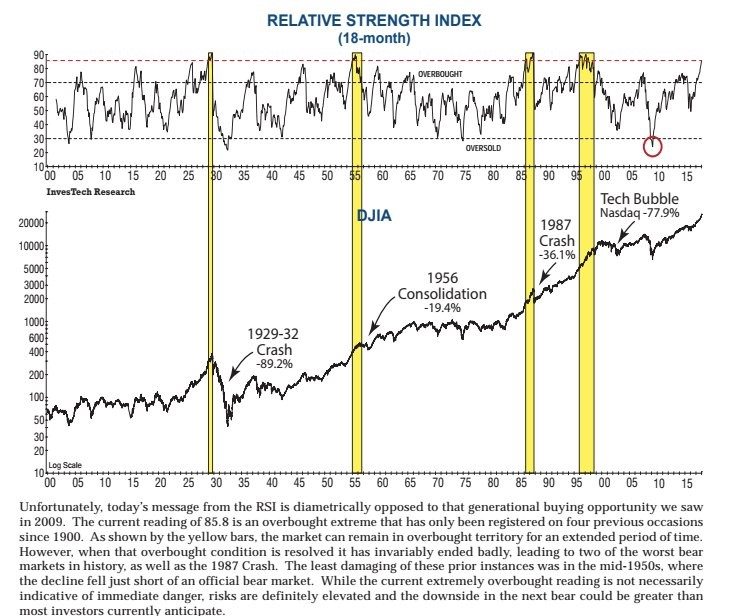
The RSI is meant to show how overextended a move in the market is whether it’s to the downside or the upside. It usually focuses on short term performance. The chart below utilizes the 18 month RSI to forecast when stock market bubbles will end. As you can see, the current RSI is above 80. Above 70 is considered overbought. The yellow bars highlight when the RSI got to a slightly higher point than it’s at now. As you can see, the highlighted periods all ended in massive declines. The weakest decline was -19.4% in 1956. This is a scary signal. The only positive this chart shows is that the optimism doesn’t portend an immediate decline. The crash can occur in a few quarters. It’s not surprising to see stocks in such a great bull market since 2009 because the financial crisis caused the RSI index to fall to the lowest level since the Great Depression. This chart uses the Dow, but the other indexes all show the same signs.
The Melt Up Is Here!
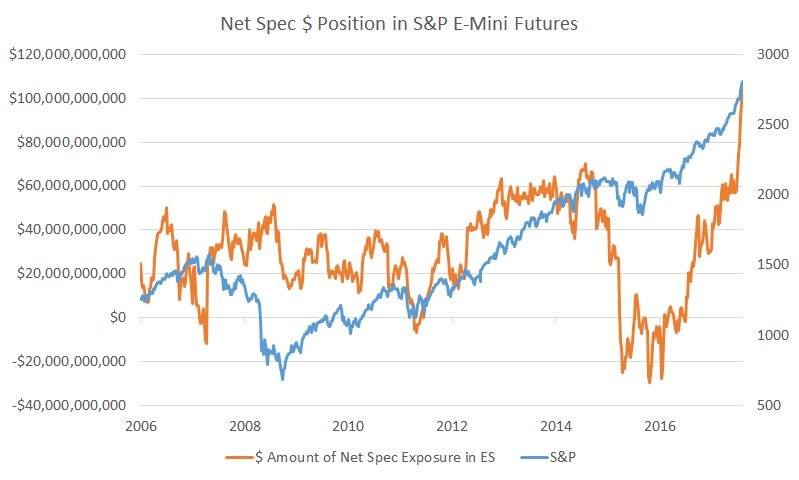
It’s funny to see charts showing how the market could be at the start of a bubble because the melt up is occurring now. It’s interesting to see how people change their minds based on the price action. The stock market has only rewarded the bulls who don’t question it. However, the moment when people are wondering if stocks can explode higher is when the downside should be of concern. As you can see from the chart below, the speculation is already here. The net speculative exposure to S&P 500 E-Mini futures is about 25% higher than it was in 2014.
Being skeptical in the face of a rally seems logical, but it has hurt to act on that skepticism. The S&P 500 has hit an all-time high every time it has closed green this year (11 out of 11). 78.6% of trading days closed at an all-time high. The previous record was 30.6% in 1995, meaning this pace is unlikely to continue. On the other hand, the S&P 500 is up 6.1% in January. Every time since 1950 the S&P 500 was up 5% or more in January the full year was up with an average gain of 24.8% (it occurred 12 times). 1987 was the only time the other 11 months of the year were down.
Money Managers Aren’t Buying Puts, They’re Buying More Stocks!
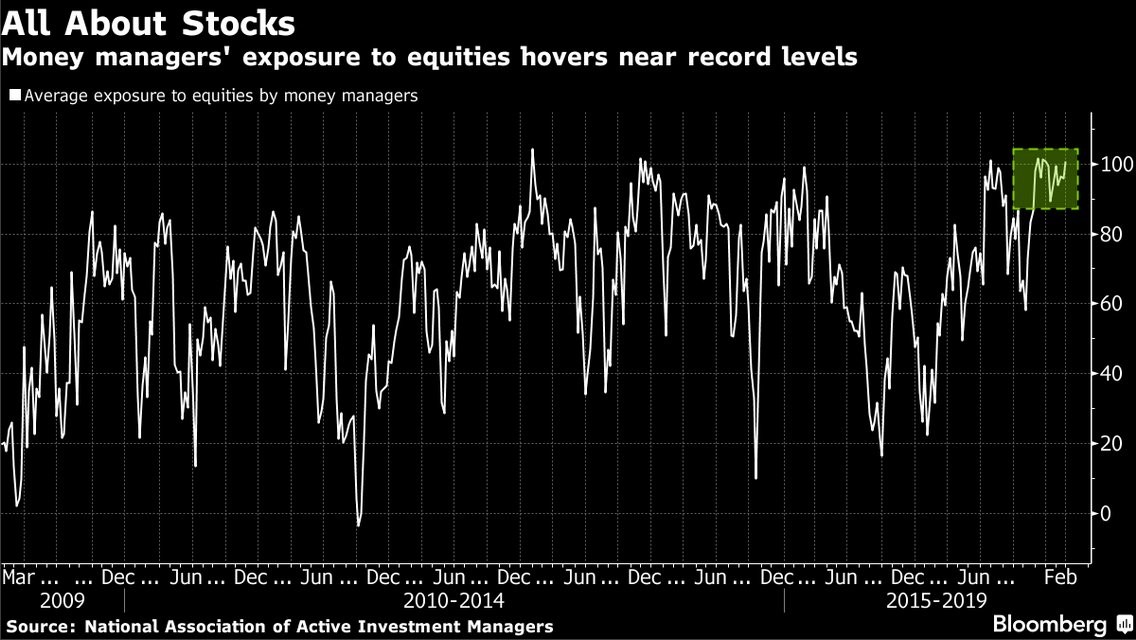
The chart below shows the National Association of Active Investment Managers report on the average exposure money managers have to equities. As you can see, their near 100% exposure is almost at the highest level since the start of this bull market. It’s not a surprise to see such optimism as the market’s performance shows just about everyone who can go bullish is bullish. You can’t keep most investors’ money if you aren’t long the market. If you aren’t long, you have been wrong.
Most professionals aren’t cautious in the face of obvious greed because their investors don’t have the same discipline as experienced investors. Their long term performance is only as good as what their investors allow. For example, part of the reason Amazon has been able to build such a successful business is because its investors have been supporting near term spending which brings long term growth. They believe in the long term mission, so Jeff Bezos has been allowed to think big while having short term quarterly losses. Secondly, as I mentioned before, the investors who have taken the most risk have been rewarded. Eventually, too many investors throw caution to the wind and the speculation phase craters like a house of cards.
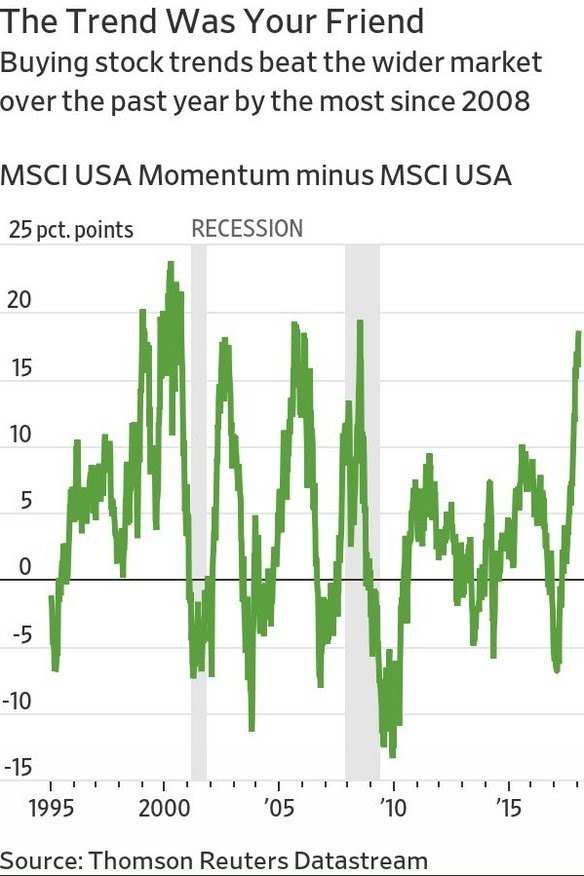
Follow The Trend, Friend
As you can see from the chart below, the momentum stocks have been outperforming the market. The key contrarian indicator is when there’s euphoria in the market combined with momentum doing well. As you can see, this indicator worked well in 2000 as the tech stocks cratered after leading the market higher. In 2007, it was the fertilizer stocks and the oil firms that led the market up before the crash as WTI went to $147. The latest rally is being driven by the banks and tech. The XLF financials index is up 6.88% year to date and the KBW regional bank index is up 8.45% year to date. The semiconductors ETF, SMH, is up 10.62% year to date.
Conclusion
When some of these indicators flash warning signs, it might be fine to ignore them, but the confluence of all these indicators showing the momentum in stocks will end soon should make you nervous. Raising some cash and buying puts hasn’t worked in the past 18 months, but it still makes sense because this trend won’t continue at this rate for much longer. The more speculation gets out of hand, the smaller the catalyst needs to be to knock the market off its perch. You would think it’s the opposite because the market has seemed impenetrable. However, the recession in 2001 wasn’t that bad, yet stocks crashed. Stocks crashed in 1987 without a recession at all.
Don Kaufman: Trade small and Live to trade another day at Theotrade.
Neither TheoTrade or any of its officers, directors, employees, other personnel, representatives, agents or independent contractors is, in such capacities, a licensed financial adviser, registered investment adviser, registered broker-dealer or FINRA|SIPC|NFA-member firm. TheoTrade does not provide investment or financial advice or make investment recommendations. TheoTrade is not in the business of transacting trades, nor does TheoTrade agree to direct your brokerage accounts or give trading advice tailored to your particular situation. Nothing contained in our content constitutes a solicitation, recommendation, promotion, or endorsement of any particular security, other investment product, transaction or investment.
Trading Futures, Options on Futures, and retail off-exchange foreign currency transactions involves substantial risk of loss and is not suitable for all investors. You should carefully consider whether trading is suitable for you in light of your circumstances, knowledge, and financial resources. You may lose all or more of your initial investment. Opinions, market data, and recommendations are subject to change at any time. Past Performance is not necessarily indicative of future results
Recommended Content
Editors’ Picks
EUR/USD holds above 1.0700 ahead of key US data

EUR/USD trades in a tight range above 1.0700 in the early European session on Friday. The US Dollar struggles to gather strength ahead of key PCE Price Index data, the Fed's preferred gauge of inflation, and helps the pair hold its ground.
USD/JPY stays above 156.00 after BoJ Governor Ueda's comments

USD/JPY holds above 156.00 after surging above this level with the initial reaction to the Bank of Japan's decision to leave the policy settings unchanged. BoJ Governor said weak Yen was not impacting prices but added that they will watch FX developments closely.
Gold price oscillates in a range as the focus remains glued to the US PCE Price Index

Gold price struggles to attract any meaningful buyers amid the emergence of fresh USD buying. Bets that the Fed will keep rates higher for longer amid sticky inflation help revive the USD demand.
Sei Price Prediction: SEI is in the zone of interest after a 10% leap

Sei price has been in recovery mode for almost ten days now, following a fall of almost 65% beginning in mid-March. While the SEI bulls continue to show strength, the uptrend could prove premature as massive bearish sentiment hovers above the altcoin’s price.
US core PCE inflation set to signal firm price pressures as markets delay Federal Reserve rate cut bets

The core PCE Price Index, which excludes volatile food and energy prices, is seen as the more influential measure of inflation in terms of Fed positioning. The index is forecast to rise 0.3% on a monthly basis in March, matching February’s increase.