Hong Kong started interim trade reporting in August 2013, with Legislative vetted rules implemented on 10 July 2015. Unlike other jurisdictions in Asia, HKMA built the trade reporting solution themselves. The Hong Kong Trade Repository (HKTR) was built by their subsidiary Hong Kong Interbank Clearing Limited (HKICL). HKICL also built/manages Hong Kong’s payment infrastructure on behalf of HKMA.
The HKMA TR infrastructure consists of two parts
- Reporting Function
Interim reporting started in July 2013 for some FX and Interest Rate (IR) products. Equity Derivatives and more FX/IR products were added in Sept 2015, Credit Derivatives and Commodity Derivatives were added in June 2016. From July 2017 reporting entities are also required to send though daily valuations.
For a full list products to be reported on please see here.
- Trade Matching and Trade Confirmation Function
This function serves as a local affirmation platform for HKEX’s OTC Clear clearing service. Only clearing members can use this service and it can only be used for trades that can be cleared at OTC Clear.
The list of organisations that are mandated/required to report is extensive and cover amongst others, licensed HK Banks incorporated in HK and licensed HK Banks incorporated outside of HK. For a full list of reporting entities that are members of the HKTR please see the following link.
HKMA has identified two “Limbs” that determine what trades need to be reported to the HKTR.
- The “Counterparty Limb” that looks at the entity in which a trade is booked and
- The “Conduct in Hong Kong Limb” that looks who was involved in the trade, for trades not booked into an entity covered in the “Counterparty Limb”
A quick summary these requirements are in the table below.
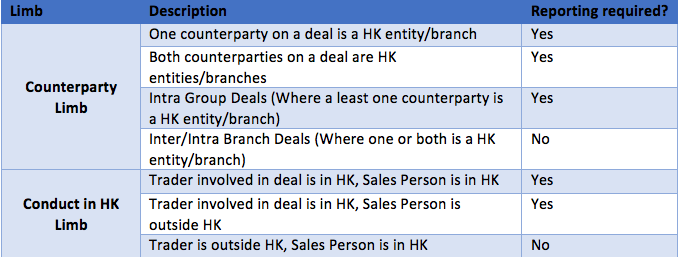
The Counterparty Limb” is pretty clear, if it is booked into an entity in HK you must reported it. The “Conduct in Hong Kong Limb” is however is subject to the structure of the business that is reporting and some interpretation. If there is a regional trading desk in HK who book trades into branches across the globe, then this desk needs to report all trades they were involved in irrespective of where the sales person sat. This leads to some double counting with other trade reporting regimes and makes the data a bit harder to analyse. For some FHQ on how trades are reported in HK please see the most recent FHQ document link
At Clarus we like trade level data, but like most other Asian jurisdictions HKMA does not provide trade level reporting. They do provide some summary reports every month.
The HK TR reports cover both turnover data and outstanding notional data for FX and IRD. We are going to focus on the turnover data for IRD. The IRD data is also broken up into sub-products (Basis, OIS and Fixed Float Trades).
Cleared versus Uncleared Trades
Let’s start by looking at the data related to clearing. I am going to start with some data that we are familiar with from US SDR.
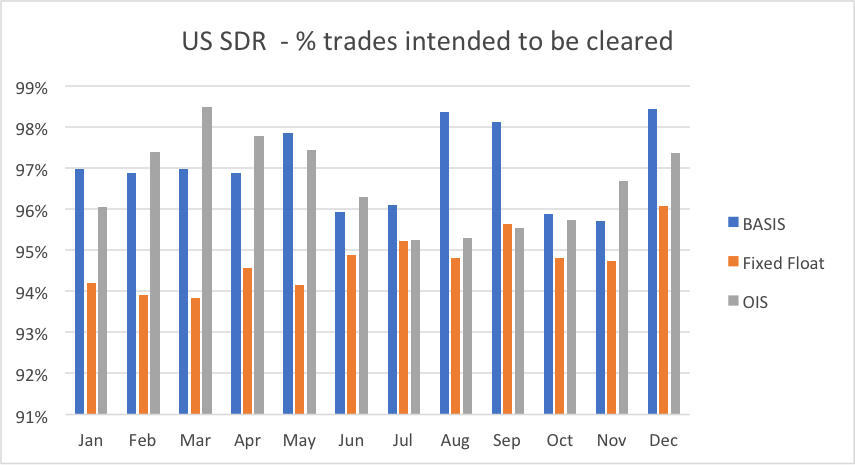
94-98% of US SDR trades (IRS – Fixed Float, Basis and OIS) are intended for clearing, for all currencies. Given the regulatory drives over the last few years and the well documented benefits of clearing, this number is expected.
If we look at the HKTR data we get a different picture.
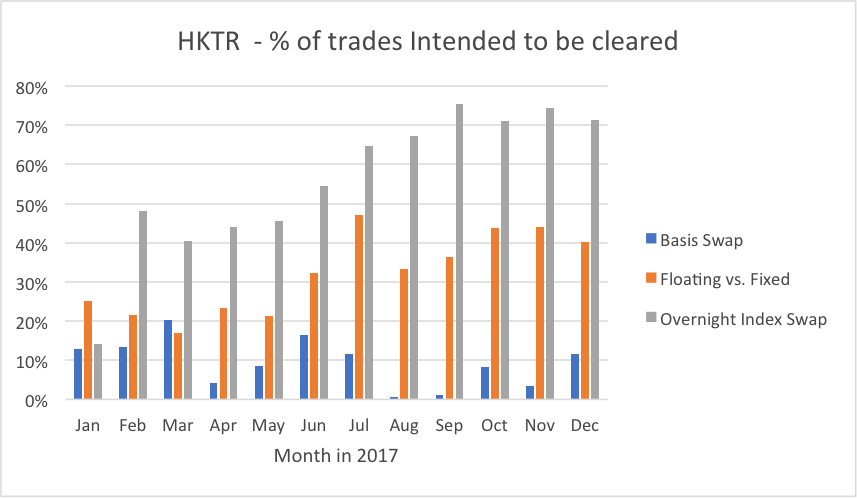
The above graph shows that
- 20-40% of Fixed Float trades are expected to be cleared
- <10% of Basis trades are expected to be cleared
- 50% of OIS trades are expected to be cleared (from Jul onwards)
This is surprising given the clearing mandate in HK but could also be due to the data set and the requirement to report intra group deals that may not be cleared.
Volumes by Currency
When we look at the break up of volumes by currency (Cleared and Uncleared) the dominant currency is USD followed by HKD, JPY, EUR, CNY, and GBP.
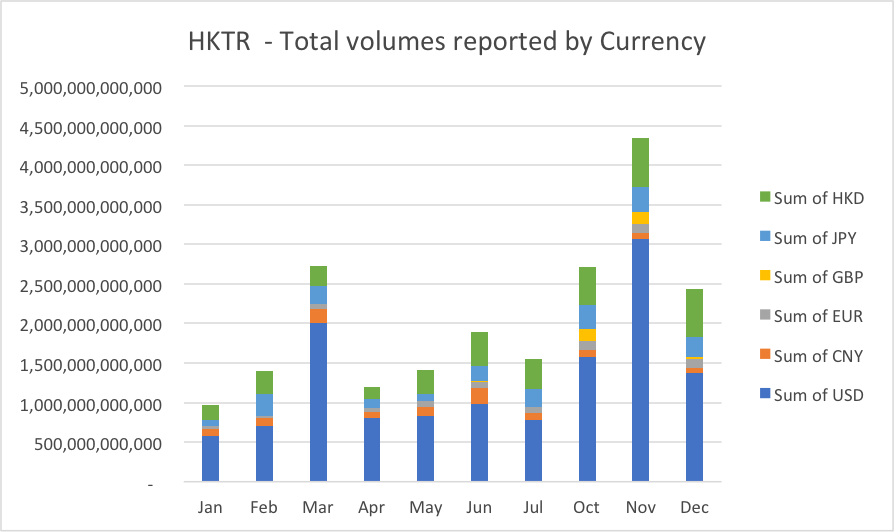
The HKTR also has a currency classification of OTHER for all currencies other (Not shown above). This OTHER classification shows slightly lower volumes that USD. It would be interesting to know where these volumes come from.
Note that in the above and in most of the next graphs on HKTR data, I have removed the data for August and September. The reason for removing data was there were many trades back loaded into the TR during these months, skewing the data.
Volumes by sub product
When you look at the breakout by product type you see the following.
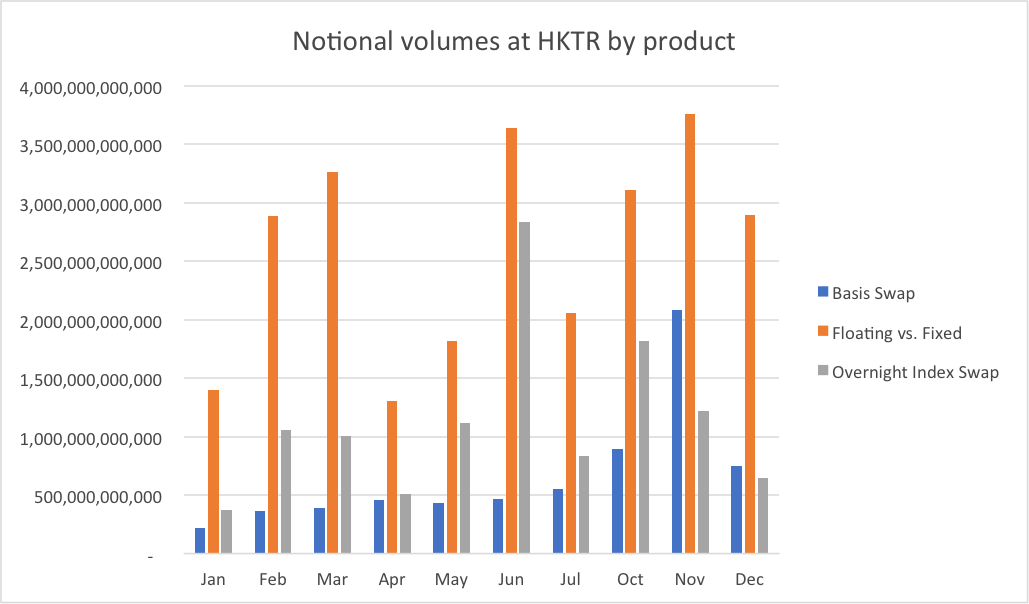
Here we can see that the most popular product to be reported is the Fixed Float trades, while the OIS is significantly lower.
If we look at the same data from the US SDR’s to compare this to the HKTR.
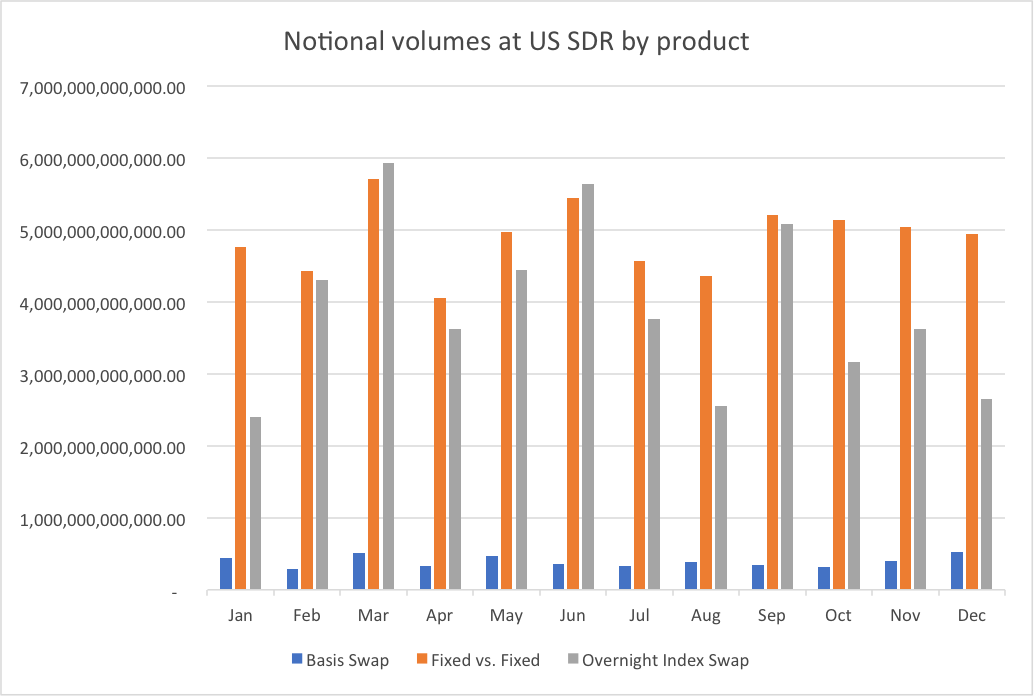
- HKTR Fixed Float volumes are 40-60% of the US SDR Volumes
- HKTR OIS volumes are about 15-35% of the US SDR Volumes
- HKTR Basis swap volumes can be multiples (2-3 times) the US SDR Volumes! This may have to do with the intra group basis swaps, or categorisation of the product, without the underlying trade data, we have no way of telling?
Volumes by Tenor
Finally, HKMA are kind enough to also give a breakdown of the transaction volumes by tenor, which for IRD is a must have but surprisingly not every jurisdiction publishes this.
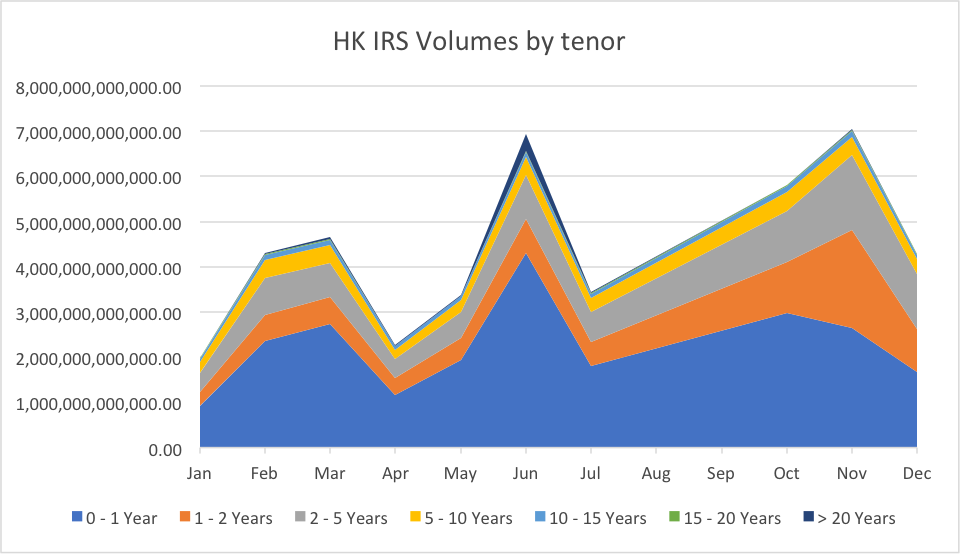
A can be seen in the above graph there is the most liquidity in the 1-2 Y and 2-5 Y bucket’s which was expected. There is an interesting anomaly in the data, in June 2017 the >20-year bucket had 18 time the average months volumes. Almost exactly 20 years after HK was returned to China?
In Summary
- Hong Kong has extensive trade reporting requirements, that cover trades booked to HK entities and trades done “In Hong Kong”
- The data reports a significantly smaller % of trades to be cleared versus the US SDR
- The data shows a strong USD currency bias, although the volumes in OIS are higher than the volumes in the US SDR.
- The larges volume of trades is in the 1-2 year and 2-5 year tenor buckets.
- Trade level data is not published, this would be very useful for further analysis in the future.