


Ag Economy Barometer Moves Higher; Weather on Producers’ Minds
By: James Mintert and David Widmar
The Ag Economy Barometer turned higher in June with the index settling at 104. The June agricultural sentiment reading was higher than during the six-month base period, which averaged 100 between October 2015 and March 2016, and was also stronger than May’s reading of 97 (Figure 1). June marked the third month in a row that the Ag Economy Barometer was markedly stronger than the nine-month low of 85 set in March 2016. However, the sentiment index during June was still lower than the post-harvest high of 116 set in October 2015.
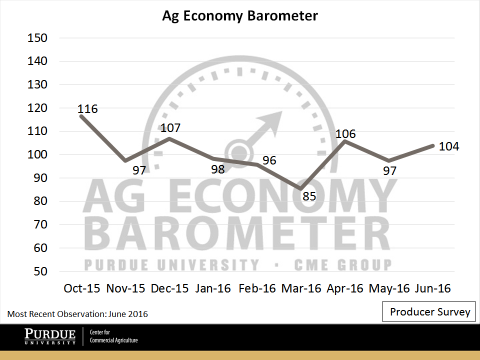
Figure 1. Purdue University/CME Group Ag Economy Barometer, June 2016.
Evaluating the Ag Economy Barometer more closely reveals the uptick in the barometer was driven primarily by an improvement in the Index of Current Conditions, which jumped up to 98 in June vs. 83 in May (Figure 2). Additional upward support was provided by the Index of Future Expectations, which is typically more stable than the Index of Current Conditions. The forward-looking index settled higher at 107 in June, equal to its April 2016 level.
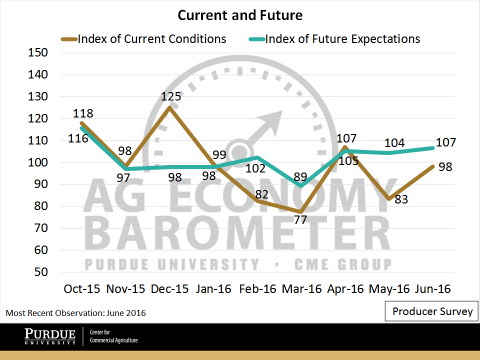
Figure 2. Producer Index of Current Conditions and Index of Future Expectations, June 2016.
A key driver supporting an improvement in producer sentiment, especially their perspective regarding current conditions, has been strength in corn and soybean markets. During June, corn and soybean prices both traded in ranges not observed since summer 2015. This was especially the case for soybean prices, which approached $12 per bushel, well above the $8.75 observed in late April and $9.80 last July (Figure 3). Overall, grain and oilseed prices both trended higher during the last three months.
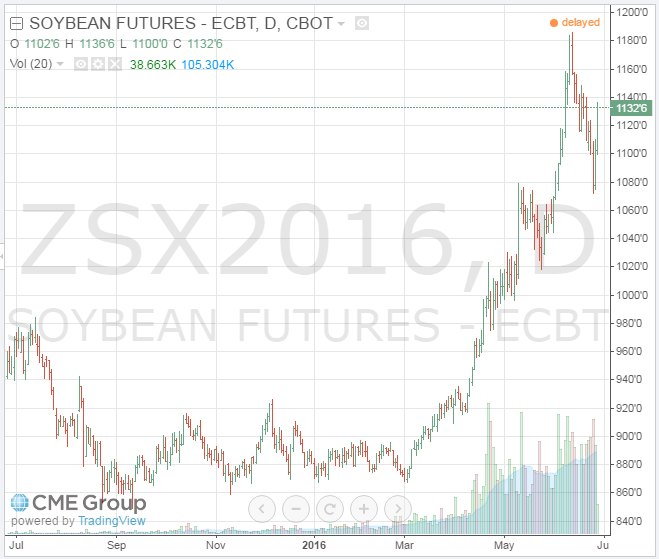
Figure 3. Future Price of November 2016 Soybeans. Data Source: CME Group, Accessed June 28, 2016.
Farm-Level Sentiment Slips; Views of Ag Economy Improve
A trend that has emerged over the last three months is a distinction between producers’ views of their own farm operations’ financial health versus the health of the broad agricultural economy. Producers hold a more pessimistic view of their own farms’ financial situations than they do of the agricultural economy. For example, after declining significantly in April, the number of producers expecting their farm operations to be worse off financially a year ahead moved higher, increasing from 27 percent in April to 37 percent in June (Figure 4). Standing in contrast with the pessimism regarding their own farms’ financial situations were respondents’ views toward the financial health of the broad agricultural economy. As shown in Figure 5, the share of respondents expecting “bad times” financially over the next 12 months for the agricultural economy actually trended lower over the same time period, declining from 75 percent in April to 65 percent in June. Reasons behind this difference in perspective are not clear, but if it continues it could be an indication that agricultural producers plan to emphasize controlling costs, perhaps by reducing expenditures.
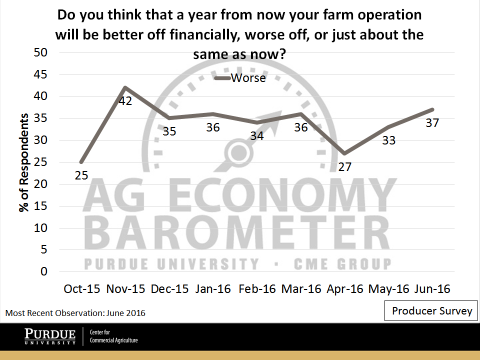
Figure 4. Share of Respondents Expecting their Farm Operation to be Financially Worse Off a Year from now.
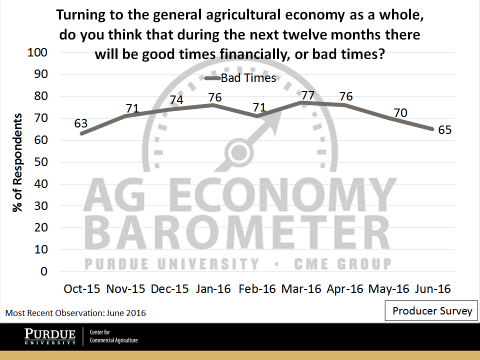
Figure 5. Share of Respondents Expecting the Broad Ag Economy to Experience “Bad Times” Financially During the Next 12 Months.
Summer Weather
While weather is always a source of concern for agricultural producers during the growing season, discussion of adverse growing conditions, and the possible impact on U.S. corn and soybean production, received more attention than typical this past winter and spring. Much of the attention focused around waning El Niño conditions and anticipated La Niña conditions. Additionally, the possibility of dry, warm conditions in the Midwest this summer has been cited as a source of recent strength in grain and oilseed prices. Given the heightened interest in possible weather impacts on production in 2016, several questions were posed to measure producer opinions regarding weather risks’ impact on their farm operations.
On the June survey, agricultural producers were asked about the likelihood of widespread, adverse impacts on 2016 crop yields associated with extreme weather events. Responses were scaled from 1 to 9, with 1 being “very unlikely” and 9 being “very likely” (Figure 4). Interestingly, 44 percent of survey respondents reported that they felt widespread, adverse impacts on crop yields this year were at least somewhat likely (rating 6-9).
Producers were also asked if they expected extreme weather events – such as those associated with El Niño or La Niña – to adversely impact crop yields in their local area over the next 12 months. When asked to focus on their local area, just over half of survey respondents (53 percent) reported that they expect extreme weather to reduce crop yields in 2016. To provide a comparison to last year, 47 percent of survey respondents indicated that extreme weather events adversely impacted local crop yields in 2015. In short, survey results suggest that nearly half of producers surveyed expect extreme weather this summer to impact U.S. crop yields and that there is a modest uptick in concerns that severe weather will affect yields on their own farms compared to last year.
Finally, we also asked producers if they had changed their farms’ marketing plans as a result of anticipated or forecast extreme weather events in the upcoming 12 months. Although the majority of respondents (71 percent) reported they had not made changes, it was notable that nearly 30 percent of respondents reported making some changes in their marketing plans because of concerns about extreme weather.
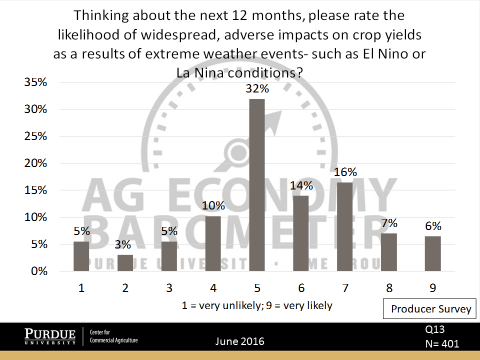
Figure 6. Rating of likelihood that widespread, adverse crop yields would occur as a result of extreme weather events.