
We’re surrounded by investment products that track indices. S&P 500 index funds seek to replicate the performance of the S&P 500 index – easily accomplished by simply buying the constituent stocks in designated weights. Other indices are more difficult to track – for example when the product invests in futures to approximate spot market returns (GSCI) or acquires only a subsample of index constituents (Barclays Ag).
A new generation of indices promises to emulate more complicated investment strategies, such as currency carry, volatility and roll trades. Investment banks now offer institutional investors an array of derivative products tied to such indices, and asset managers are packaging them into ETFs and other fund products.
One problem, however, is that newly created indices tend to overstate historical, hypothetical performance. From a commercial perspective, there’s little point in launching a new index if the pro forma returns are unattractive; consequently, there’s a strong incentive to adjust the calculation methodology until the results look favorable.
Further, unlike mutual funds, indices can be created and published with minimal disclosure of key information, such as when the index went “live” and what assumptions are made about trading and other costs. The combination can mislead investors who may expect actual net of fee fund returns to match hypothetical gross of fee index returns.
A case study is the PowerShares Multi-Strategy Alternative Portfolio fund (LALT), an active ETF launched at the end of May 2014. This Fund seeks to match or outperform the Morgan Stanley Multi-Strategy Alternative Index (Bloomberg ticker MSUSLALT), comprised of a combination of risk premia strategies designed to deliver absolute returns.
Unrealistic historical index returns
On Bloomberg, the Index data begins on 1/1/2003. Given the start date, it is possible that the Index was launched sometime in 2013 with roughly ten years of backfilled data. Unfortunately, there is no requirement to differentiate between backfilled and live results, and neither the LALT prospectus nor Bloomberg sheds any light on when the Index went “live.”
The backfill thesis is supported by historical performance. The following chart shows the Index returns for the ten years preceding the launch of LALT against the S&P 500 and HFRIFOF index.

Over the decade, the Index “returned” 6.83% per annum with an annualized standard deviation of 2.93% and a Sharpe ratio of 1.64. The maximum drawdown – during a period that covers the Great Financial Crisis – was only 2.33%. The Index “delivered” almost 90% of the return of the S&P 500 with one fifth the volatility. Annual performance was almost 350 bps higher than that of the HFRI Fund of Funds index, which has limited data bias and generally represents live performance. The following table provides some summary statistics:
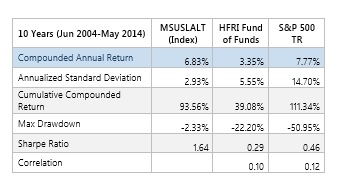
If the Index represented actual performance, it would rank among the best performing hedge funds over the past decade. In fact, the risk adjusted return (Sharpe ratio) was better than 97% of all hedge funds in the HFR database over the same period. Only three live hedge funds had smaller drawdowns. Plus, unlike investing in illiquid and expensive hedge funds, the performance in theory was achievable at low cost and with daily liquidity.
Disconnect between hypothetical and live returns
Since launch, however, both the Index and Fund have failed to meet these high expectations – to say the least. Each is down approximately 8% since May 2014 – underperformance of 600 bps versus the HFRXGL (daily investable hedge fund) index, which itself tends to underperform the HFRIFOF index by 100-200 bps per annum due to adverse selection bias. The drawdown over the first seven and a half months is more than triple the hypothetical drawdown over the ten preceding years – during a time when the S&P has risen 8%.
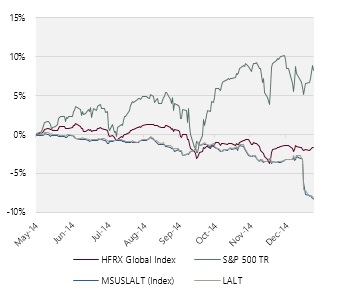
Looking at the live returns, it appears that the Fund and Index were hurt when the Swiss Franc decoupled from the Euro on January 15, 2015. This underscores the backfill issue: while the Index “sidestepped” any major adverse market events over the past decade, both the Index and Fund walked into a proverbial propeller seven months after launch.
This issue is particularly timely given the plethora of complicated risk premia products introduced by investment banks over the past two years. Most indices created recently will be subject to the same backfill bias highlighted above. A live index, the Merrill Lynch Foreign Exchange Arbitrage Index, is down over 6% in January – but will currency carry indices launched in the future show better pro forma results? And will investors appreciate this distinction?
In order to better align investor expectations with likely performance, indices should be subject to the same rigorous disclosure requirements as funds: investors should know when the index went “live,” which performance is hypothetical, and what assumptions are made about costs and expenses. Otherwise, the tendency to publish only successful indices will persist.