For several weeks, our focus has been on the divergence between the major large capitalization averages, representing stocks with good volume and liquidity along with reasonable dividends and the lagging smaller capitalization issues while commenting eventually the continuing disparity will be resolved either by the big capitalization indexes declining, or by the laggards finding support and turning higher. Last Thursday, in response to the ECB announcements the small – caps, representing greater risk, came alive.
In this issue, we explore the obvious question, can the small – caps continue higher and are the major indexes overbought and due to retest breakout highs??
Market Review
S&P 500 Index?(SPX) after significant advances Thursday and Friday it is difficult to defend the overbought proposition. Indeed, as we explain below, some fading signals from the futures and option markets are starting to appear. There are two well-defined support levels to watch when it pulls back; the first is Thursday’s breakout above 1925 while the second and more important one is support at the breakout above the May 13 high of 1902.17.
iShares Russell 2000?(IWM) the divergence leader caused the greatest possible pain last week after failing to find support at the 112.02 gap triggering closure of the long June 111/115 call spread suggested three weeks ago?only to reverse up in response to the ECB news Thursday. However, now there is some concern that a further continuation back up to the 117.50 level followed by a subsequent decline would finally set up a potential a Head & Shoulders Top with neckline way down at 107.50. For now, this seems like a remote possibility given the strength in the larger capitalization indexes, but they look overbought and will likely retest breakout highs soon.
CBOE Volatility Index??(VIX) declined again last week by .67 to the lowest level since February 23, 2007 when it closed at 10.58.
The table below shows the VIX cash compared to the next two futures contracts as well as our calculation of Larry McMillan’s day-weighted average between the first and second months.
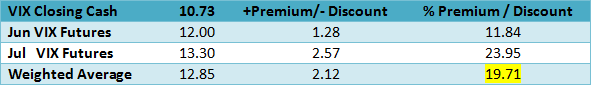
The day weighting applies 35% to June and 65% to July for an average premium of 19.71% shown above. Our alternative volume-weighted average between June and July, regularly found in the Options Data Analysis section on our homepage, is slightly lower at 17.68%. We consider premiums less than 10% to be cautionary while the premiums for a normal term structure are 10% to 20%. Premiums above 20% are unsustainable suggesting a lack of enthusiasm for VIX hedging. From a contrary regression to the mean perspective, it suggests caution. Last week the range was from a low of 13.36% Thursday to a Monday high of 19.97%, representing a normal term structure for an advancing market. However, VIX hedging activity continues to increase, for example last week through Thursday the VIX futures open interest increased by 30,596 contracts.
VIX Options
With a current 30-day?Historical Volatility?of 60.99 and 59.46 using?Parkinson’s range method, the table below shows the Implied Volatility (IV) of the at-the-money VIX calls and puts using the futures prices based upon Friday’s closing option mid prices along with their respective month’s futures prices, since the options are priced from the tradable futures.
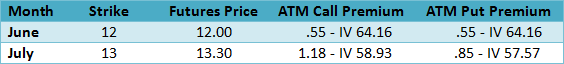
Compared to the range historical volatility of 59.46 to the implied volatilities show the June at-the-money options as slightly higher while July’s are at fair value. Friday’s volume was high 872,030 contracts compared to the weekly average of 664,870 contracts. The increased volume along with increasing open interest suggests more hedging enthusiasm while options are still inexpensive in implied volatility terms relative to the 52-week historical range of 44.89 – 117.20.
While at the VIX is near the lows of 2007 we notice the Implied Volatility Index at 54.71 began rising during the week closing up 6.55 for the week.
At the extremes, one important thing to remember is regression to the mean, a dynamic process where successors to the outliers are predetermined to return to the center.
“The driving force is always to toward the average, toward the restoration of normality? Regression to the mean motivates almost every variety of risk-taking and forecasting.” Peter Bernstein,?Against the Gods
CBOE S&P 500 Skew Index?(SKEW) measures the purchase of out-of-the-money S&P 500 Index puts that require a very large downside move to profit from long put positions. An increase of this index indicates greater expectations for an extreme down move.
SKEW declined 1.35 last week remaining well below the midpoint of our arbitrarily defined relevant range of 127.97 defined by the rapid decline to 112.66 on March 14, followed by the spike higher to 143.27 on March 17. Until it closes above 127.97, we consider SKEW remains in the bullish camp. However, a close above 130 would be a sign that out-of-the money put buying increased enough to pay close attention. This would be a confirming indicator along with the increasing VIX futures open interest and option volume noted above.
US Dollar Index?(DX) despite Thursday’s announcement from the ECB the dollar remained almost unchanged as the Euro initially declined on the news but quickly gave back any gains and then seemed unimpressed with Friday’s US employment report so the range defined by the low at 79 and 80.50 remains the focus.
iShares Barclays 7-10 Year Treasury ETF?(IEF) ?indeed interest rates did decline as low as 2.40% intraday on May 29 as IEF reached 104.53 in a “risk off” flight to the safety of Treasuries perhaps due to macro concerns more than expectations for a slower US economy. Then it abruptly declined to close below the current multi-point upward sloping trendline defined by the low of 100.86 made April 2 where it closed Friday adding some support for the “risk on” view that would change should it advance back above the trendline.
iShares Dow Jones Transportation Average Index?(IYT) ?since advancing 12.3% from the April 14 correction bottom compared to 7.4% for the S&P 500 Index the argument can be made the transports are overbought and due to correct. However, as one of the most economically sensitive groups they usually outperform early in market cycles. While the airlines have received considerable attention, consider this quote from the Association of American Railroads (AAR).
“f you’re looking for a sign that the economy is shaking off its first quarter lethargy, rail traffic in May could be that sign,” said AAR Senior Vice President John T. Gray. “Crushed stone, steel, motor vehicles, lumber, chemicals? the list of commodities showing carload gains in May goes on and on. And intermodal continues to surge. All in all, there’s very little to dislike about May’s rail traffic figures. We hope it really is a sign that the economy is beginning a period of solid growth.”