


The CBOE Volatility Index (VIX), also known as the Fear Index, is the key measure of market expectations of 30 day volatility of the S&P 500 stock index option prices. In 2013, the VIX was a great indicator of short-term fear. This created many great opportunities to put capital to work. In this vein, it is also amazing how quickly fear returns to the markets with each pullback. Traders and money managers seem to remember 2008 all too well and get skittish each time the market starts to pull in. And this has assisted in keeping the equity markets elevated.
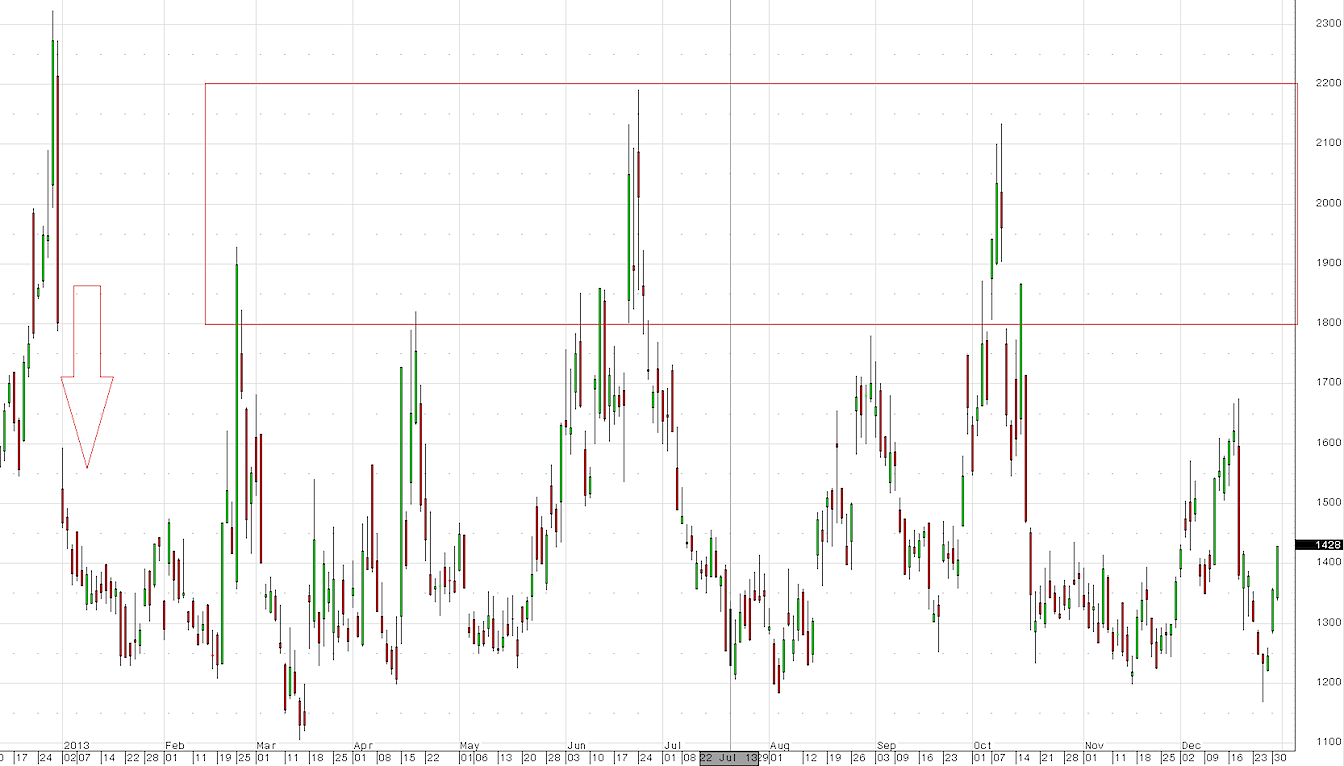
On 4 separate occasions this year the VIX spiked over 18 quickly and then crashed a few days later as traders stepped in to buy the dip. We saw a major crash in Volatility Index back on Dec 31st into the new year when the market gapped up strong on news regarding the fiscal cliff nonsense.
2013 VIX Volatility Index Chart
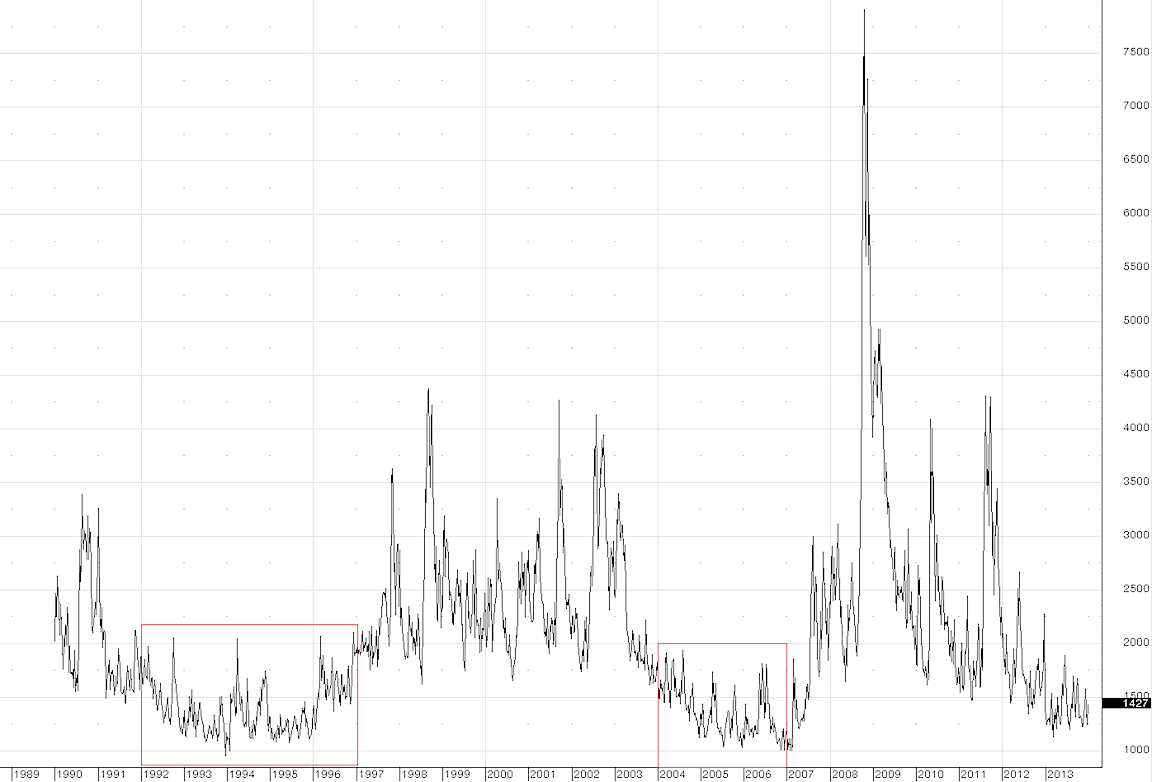
I often hear investors question whether or not the VIX can stay under 20 for an extended period of time. And the answer is yes. 1992-1996 and 2004-2006 were periods where volatility remained relatively low and the VIX remained for the most part under the 20 level. (Highlighted with the red boxes)
VIX Volatility Index Long-Term Chart
It’s a good idea for active investors to read the CBOE website to gain a better understanding on how the VIX index works and how it’s calculated. Above charts from CQG.com. Happy New Year!
The material provided is for informational and educational purposes only and should not be construed as investment advice. All opinions expressed by the author on this site are subject to change without notice and do not constitute legal, tax or investment advice. At Castle Financial, securities are offered through Cadaret, Grant & Co., Inc. and TD Ameritrade, Inc. Members FINRA/SIPC.
No position in any of the securities mentioned at the time of publication. Any opinions expressed herein are solely those of the author, and do not in any way represent the views or opinions of any other person or entity.
This article was was written by Korey Bauer and originally published by See It Market. Original article link.
© 2024 Benzinga.com. Benzinga does not provide investment advice. All rights reserved.
Trade confidently with insights and alerts from analyst ratings, free reports and breaking news that affects the stocks you care about.

