Get Indexology® Blog updates via email.

In This List

How did South African active managers perform against their benchmarks in 2014?

Asia Fixed Income: Opening of the China Onshore Repo Market

The Smarter Investor

European Government Bond Markets Absorb a Lot of Market Info in the First Week of June

Tax-Aware Superannuation – A Closer Look at Dividends

How did South African active managers perform against their benchmarks in 2014?

Contributor Image
Daniel Ung

Former Director

Global Research & Design

Following the success of the SPIVA (S&P Indices versus Active) in the U.S., Australia, Canada, India, Japan, Europe and Latin America, we are now starting coverage on South Africa. Like the reports covering other regions, we aim to shed some light on the ongoing active vs. passive debate.  SPIVA South Africa will be published twice a year, mid-year and at the end of the year.

Let’s take a look at the results of the past year.

Overall, 2014 was somewhat mixed for South Africa, owing to labor disputes, electricity shortages and weak domestic demand. However, the performance of ZAR-denominated domestic equities, as measured by the S&P South Africa Domestic Shareholder Weighted (DSW) Index, held up reasonably well and went up by 16% over the year. However, they still lagged global equities as a whole.

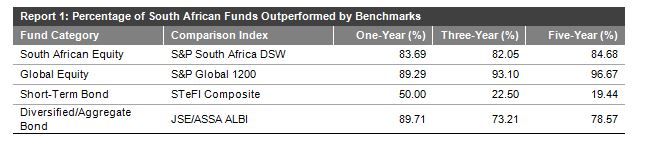
Given the volatility over the year, we would have expected active managers to outperform their benchmarks but this did not turn out to be the case. Indeed, South African active equity managers underperformed their benchmarks in all equity fund categories and over all time horizons. (see Report 1 below).

In regards to fixed income, the results were less consistent. While active managers beat their respective benchmark in the short-term bond category, this was not the case in the longer-term diversified/aggregate category.

Capture

The posts on this blog are opinions, not advice. Please read our Disclaimers.

Asia Fixed Income: Opening of the China Onshore Repo Market

Contributor Image
Michele Leung

Former Director, Fixed Income Indices

S&P Dow Jones Indices

On June 3, 2015, the PBoC announced the opening of the China onshore repo market; the offshore RMB-clearing and participating banks will be allowed to trade bonds on repos in the onshore interbank bond market.  This is an important development for the offshore RMB market, as it will broaden the offshore RMB supply and support further RMB capital account reform.

By connecting the onshore and offshore money markets, the difference in interest rates between the two markets is expected to narrow.  In fact, if we look at the yield performance of the offshore market, represented by the S&P/DB ORBIT Index, and the onshore market, represented by the S&P China Bond Index, we see that the spread has significantly reduced from 206 bps in early 2014 to 17 bps as of June 3, 2015.  The offshore yield has traded above the onshore yield since 2014, on the back of the weakening currency and tightening liquidity in the offshore market.  Beyond the convergence, their responses to market conditions have also become more in-sync, particularly during the recent rate cut.  It is interesting to note that the correlation between the two yield performances was -0.8 in 2014, whereas in 2015 YTD, it rose to 0.8; this implies that the two markets may be becoming more correlated.

Nevertheless, some differences remain. For example, in the perspective of monetary policy and liquidity, the onshore and offshore RMB money markets have different market dynamics. Additionally, in terms of market structure, some of the issuers in the offshore market are foreign names and a portion of the offshore RMB bonds received international bond-level ratings, whereas the onshore market is dominated by domestic issuers, and they are rated by local ratings agencies only.

Please see the yield chart in Exhibit 1 and index performance in Exhibit 2.

Source: S&P Dow Jones Indices LLC. Data as of June 9, 2015. Past performance is no guarantee of future results. Chart is provided for illustrative purposes. Note: S&P/DB ORBIT SQS Index is the S&P/DB ORBIT Sovereign and Quasi-Sovereign Index.
Source: S&P Dow Jones Indices LLC. Data as of June 9, 2015. Past performance is no guarantee of future results. Table is provided for illustrative purposes. Note: S&P/DB ORBIT SQS Index is the S&P/DB ORBIT Sovereign and Quasi-Sovereign Index.

The posts on this blog are opinions, not advice. Please read our Disclaimers.

The Smarter Investor

Contributor Image
Chris Bennett

Former Director, Index Investment Strategy

S&P Dow Jones Indices

Investors have spoken: There is a world outside of traditional indexing, and they want in.

“Smart beta” or factor indices bridge the gap between active and passive management by allowing investors to tilt toward specific investment attributes – for example, low volatility or high dividend yield.  These indices use factors in a rules-based, transparent manner to determine index composition and/or weighting. Smart beta products give passive investors access to factor exposures that were once only available through active management.

Smart beta has flourished, attracting more assets than ever before. According to our 2014 Survey of Indexed Assets, AUM in products linked to S&P DJI smart beta indices grew 55% in 2014.  As the demand for factor indices has increased, so too has their availability. We’ve created indices to provide a wide variety of exposures, while still maintaining the advantages of passive management.  The growth of ETFs as a delivery vehicle has complemented the growth of factor indices, enabling investors to seek new opportunities.

That said, demand for smart beta has not been cannibalistic; passive investment in traditional exposures has also increased. AUM growth in products indexed to the S&P 500 outpaced the growth of the index, indicating positive net flows into traditional cap-weighted investments. The demand for first-generation indexed investments has not decreased in the wake of new “smart” offerings.

Much research (including our SPIVA reports) confirms that most active managers underperform most of the time. The probability that an active manager beat his benchmark is low, and the probability that he did it consistently is even lower. Positive inflows into passive vehicles indicate that investors have heeded these data, and that the smarter investor prefers better odds.

The posts on this blog are opinions, not advice. Please read our Disclaimers.

European Government Bond Markets Absorb a Lot of Market Info in the First Week of June

Contributor Image
Heather Mcardle

Director, Fixed Income Indices

S&P Dow Jones Indices

European bonds markets had a lot to take in last week.  For the most part, they all responded with a downward price reaction regardless of risk profile, with the exception of Greece.  The ECB left monetary policy unchanged.  Eurozone inflation for May climbed to 0.3%, indicating that QE is having the desired effect.  Greece chose to bundle its June payments to the IMF into one payment scheduled for June 30, 2015, buying them more time to negotiate their debt obligations.  Last, strong employment numbers out of the U.S. pointed to possible Fed rate hikes, which is always a catalyst for a bond market sell-off.

This reaction indicates that, despite continued uncertainty out of Greece, the European bond market is turning away from a “flight to quality” stance.  This could be due to a perception that Greece is on the right track to meet its loan obligations, and/or it could be due to improving economic signs both in Europe and in the U.S.  Spain and Italy, two countries tied to the “risk-on“ trade, also moved down in tandem with the countries associated with the “risk-off”/“flight to quality” trade like Germany.

If we look at data from the close of June 1, 2015, to the close of June 8, 2015, yields on most European government bond markets significantly widened (while bond prices went down).  The S&P Germany Sovereign Bond Index and the S&P Spain Sovereign Bond Index both widened 18 bps, the S&P Italy Sovereign Bond Index widened 16 bps, and the S&P Ireland Sovereign Bond Index widened 24 bps, while the S&P Greece Sovereign Bond Index ended unchanged for this period after tightening 8 bps on Friday.

Capture

The posts on this blog are opinions, not advice. Please read our Disclaimers.

Tax-Aware Superannuation – A Closer Look at Dividends

Contributor Image
Harry Chemay

Co-Founder & CEO

Clover.com.au

This is the third blog in a series on the evolution of Australia’s tax-aware investment management (TAIM) landscape.

Large asset owners, including statutory authorities, university endowments, and charitable bodies dominate the Australian investment landscape.  However, the largest asset owners by asset size are the 260-odd superannuation funds who collectively manage some 60% of Australia’s ~AUD 2 trillion pool of retirement savings known as superannuation. Each fund pays tax on taxable contributions made by employers and members, together with income and capital gains earned on investment assets.  Super funds do not, however, pay tax on earnings of assets backing pensions.  In Australia, super funds either pay tax at a notional rate of 15% for working members, or 0% for members in pension mode who are 60 years or older.

What difference do these tax rates have on returns experienced by members? In the case of Australian shares that pay dividends, quite a great deal as the below chart illustrates:

Capture

Members in accumulation (working) mode might incur a tax of between 10% and 15%, or receive an uplift of up to 21% on their Australian shares.  Members over age 60 and in pension mode either have no tax effect or receive an uplift of up to 43% on each dollar of fully-franked dividend attributed them.

Given the low rate of tax paid by superannuation funds, their ability since 2000 to recoup excess franking credits, and the large difference in tax effect between working and pension members, one would assume that super trustees would be among the most tax aware of investment fiduciaries.  However, recent history has painted quite a different picture, which will be discussed in the fourth, blog in this series.

To learn more about how to weigh your after-tax benefits, visit www.spdji.com/tax-aware.

The posts on this blog are opinions, not advice. Please read our Disclaimers.