The one thing that I love about writing a daily blog and a weekly newsletter is the thoughtful commentary AND criticism that I receive along the way. I have always solicited thoughtful discussions and, besides the few inevitable "trolls" that show up now and then, I have learned much from the "community" along the way. For that, and your readership, I am very thankful.
The reason that I bring this up is that I received a very interesting email this past weekend from Earl A. To wit:
"There are a few indicators upon which I have come to rely heavily during this Fed induced bull market to avoid becoming too bearish. One is the slope of the VIX forward futures curve which can be readily approximated by (VXZ)/(VXX). Another is the BOAML US High Yield Option Adjusted Spread. These two, in particular, seem to be good barometers of investor risk tolerance. Since I expect that the next bear will likely have its genesis in the high yield space, the later should be a good warning signal as well.
I'm a long time ValueForum member and look forward to your presentation next Saturday in Scottsdale. I'll be doing a presentation on Tactical Asset Allocation earlier the same morning. I hope we'll get a chance to say hello."
- (As Earl notes, I will be doing a presentation at the ValueForum this weekend in Scottsdale and will post my presentation slides for you very shortly.)
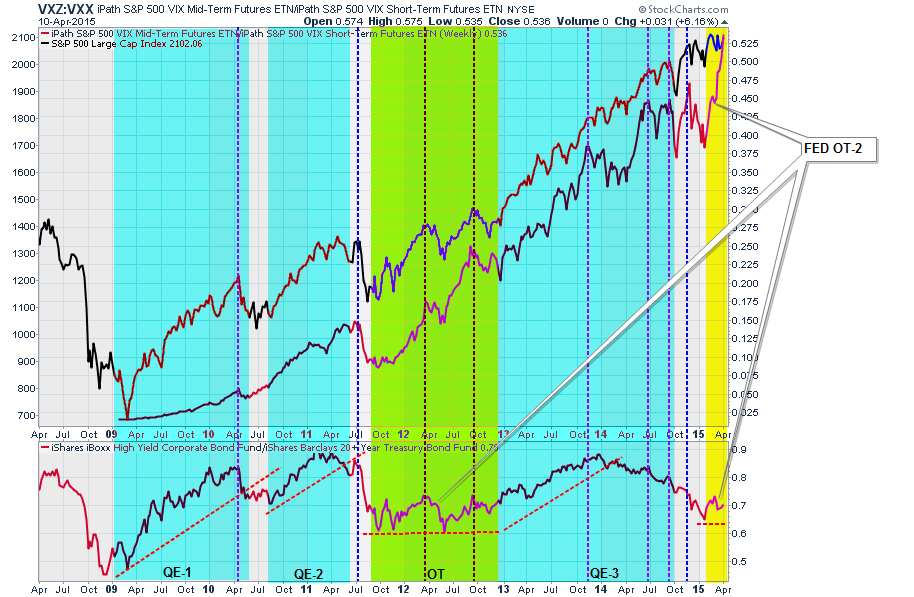
His comments on market warning signals are very interesting and I have not previously looked at the Mid- to Short-Term VIX ratio as shown in the chart below.
I have also noted the start and ending points of the Fed's quantitative easing cycles as well as the ratio of high-yield to U.S. 10-Year Treasury bond prices. There are several points to discuss.
First, when the volatility ratio is rising it has been coincident with the Fed's intervention programs and coincident rises in asset prices. Rises in both asset prices and the volatility ratio ended when the Fed ended their monetary programs. I have also noted that sharp spikes in the volatility ratio also coincided with short to intermediate term market peaks. (vertical blue dashed lines)
Secondly, the bottom chart shows the ratio between high-yield bond prices and 10-year Treasury bond prices. Notice that during actual QE programs the chase for "yield" accelerated. However, during lack of monetary stimulus or during "reinvestment" programs like "Operation Twist (OT)" the demand for excess risk taking quickly subsided.
Importantly, note the decline in "risk taking" started most recently in January of 2014 which coincided precisely when the Fed began to "taper" QE-3. Since its conclusion last October, the ratio between high-yield bond prices and treasury bonds has once again begun to flatline as the Fed continues to "reinvest" balance sheet income in an un-official "operation twist" campaign.
Lastly, since January of this year, the mid-to-short-term volatility index ratio has spiked sharply as the markets have struggled higher. Not unlike 2010, 2011 and 2012, these spikes in the volatility index ratio as markets were consolidating led to either short to intermediate-term corrections.
Also, the spike in the volatility index ratio combined with the "risk off" attitude of bond investors suggests that a risk of correction from current levels is elevated.
Currently, the "bullish trend" of the market remains firmly entrenched which suggests that portfolios should remain more heavily tilted towards equity exposure. However, that does not mean that this will always be the case. Earl's commentary is correct, and the current measures of investor "risk tolerance" is clearly waning. At what point, or with what catalyst, that sends investors running for cover is unknown.
However, as Noah Smith noted in his recent Bloomberg column: "What causes recessions? Unexplained shocks to investment."
While there are a litany of articles written about markets climbing a "wall of worry," what is crucial to remember is that this is always the case, until it isn't. It is only in hindsight that the obvious causes of the next market reversion and subsequent recession will be clearly seen. Unfortunately, for most, that revelation will be of little real value.

