Get Indexology® Blog updates via email.

In This List

Fundamental Drivers for Airlines

Energy Continues its Performance Drag on Bonds in August

OK Jobs Report Gives No Hint for the Fed

What Rising Rates Won’t Do

Large Cap Funds: Active Versus Passive

Fundamental Drivers for Airlines

Contributor Image
Todd Rosenbluth

Director of ETF and Mutual Fund Research

S&P Capital IQ Equity Research

In the first seven months of 2015, the S&P 1500 Airline index declined 11%, as we think investors focus on capacity additions with a worrying eye.  However, S&P Capital IQ thinks that airline execs have learned from past costly mistakes on adding too much capacity and forecasts 2015 as a record profitability year, driven by revenue growth and the benefits of lower oil prices.

Airline stocks such as Alaska Air Group, American Airlines, Delta Airlines and JetBlue Airways are represented in the S&P Transportation Industry Index. As of August 5, airlines had a 26% weighting in the S&P index, second only to trucking. Meanwhile airlines were a smaller yet meaningful 5.0% weighting in the S&P 500 Industrials index.

According to Jim Corridore, an S&P Capital IQ equity analyst, years of consolidation, bankruptcies, and capacity adjustments have given the airlines increased pricing power, which has led to rising industry revenues and passenger yields over the past five years. Fare increases, fewer fare sales and an increased mix of business travelers (who tend to pay more for tickets) contributed to industry revenue growth. Average fares have risen sharply over the past five years and passenger load factors (a measure of how full, on average, flights are) are at record levels for the industry. In 2014, the load factor was 83.4%, up from 83.1% and 82.8% in 2013 and 2014, respectively.

Meanwhile, much to the displeasure of passengers, airlines have been adding and increasing these fees in an effort to shift their customers toward an “unbundled” strategy of paying a base fare for air travel plus additional fees for whatever “extras” the customer may require, like a checked bag or a hot meal. Bag fees and reservation change fees alone accounted for $4.6 billion in revenues in 2014, up from $3.5 billion in 2012, according to statistics from the Bureau of Transportation Statistics.

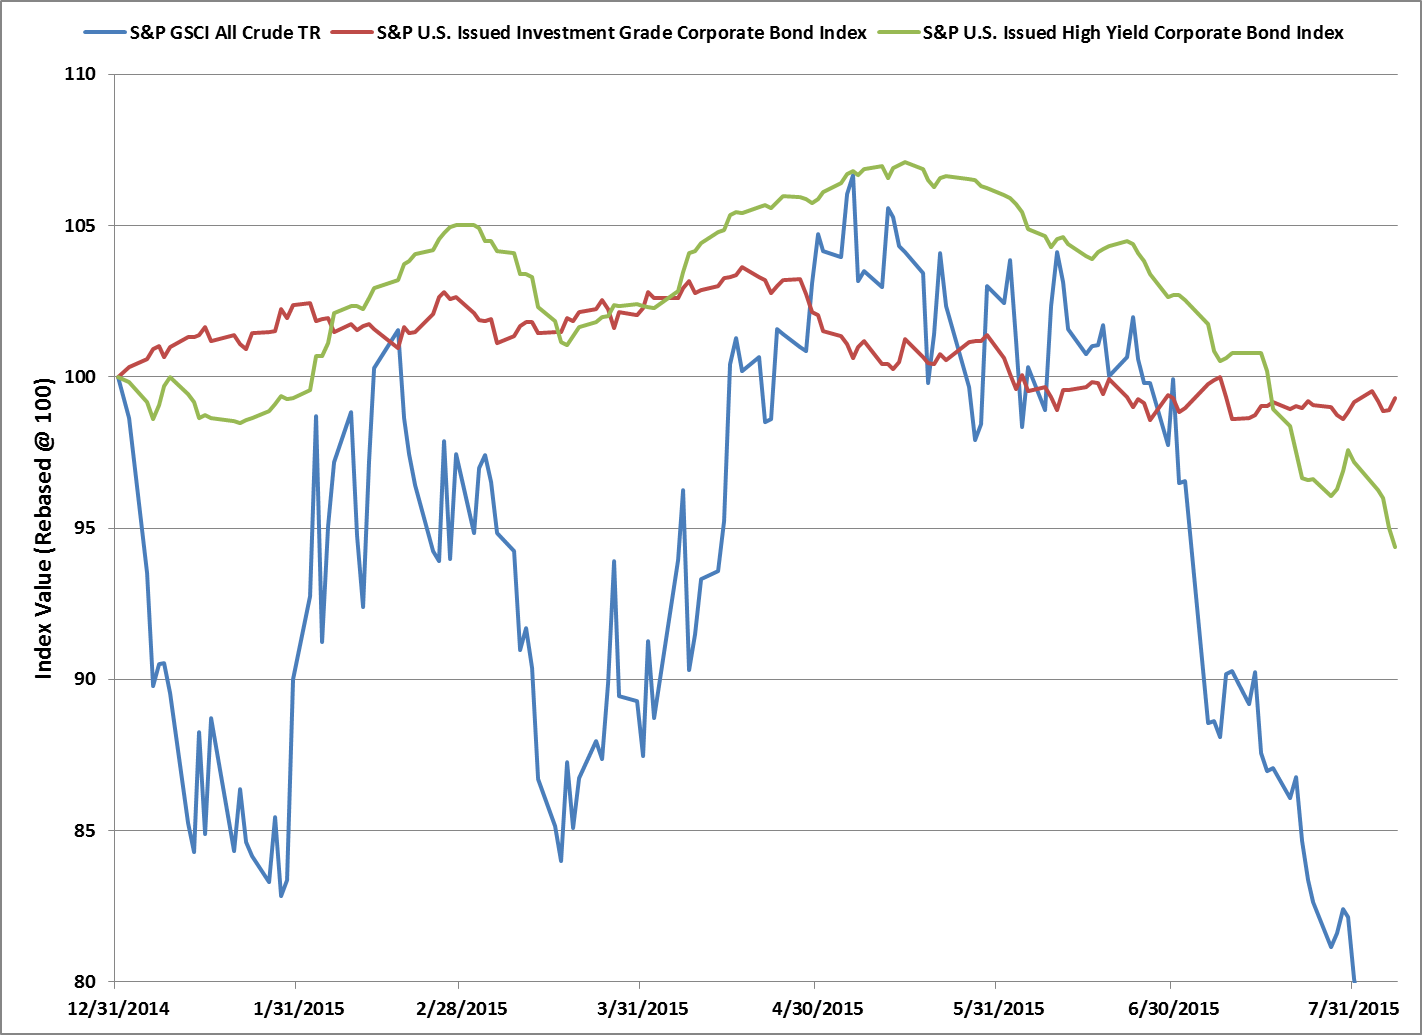
From a cost perspective, the U.S. airlines industry consumes about 19-20 billion gallons of jet fuel a year, according to Corridore, so lower oil prices can drive significantly lower costs. For many years, jet fuel has been the largest cost category for most U.S. airlines, eating up about a third of the industry’s revenues. Oil prices were recently around $45 a barrel, down more than 50% from a year earlier.

S&P Capital IQ sees fuel costs for Delta Airlines (DAL) falling 25%-35% in 2015, as DAL benefits from operating its oil refinery, as well as from lower oil prices, partly offset by losses on hedging contracts entered into at higher fuel prices.

There are a number of industrial ETFs that have exposure to the airline industry.

Please follow me @ToddSPCAPIQ to keep up with the latest ETF Trends

—————————————————————————————————–
The views and opinions of any contributor not an employee of S&P Dow Jones Indices are his/her own and do not necessarily represent the views or opinions of S&P Dow Jones Indices or any of its affiliates.  Information from third party contributors is presented as provided and has not been edited.  S&P Dow Jones Indices LLC and its affiliates make no representations or warranties of any kind, express or implied, regarding the completeness, accuracy, reliability, suitability or availability of such information, including any products and services described herein, for any purpose.

The posts on this blog are opinions, not advice. Please read our Disclaimers.

Energy Continues its Performance Drag on Bonds in August

Contributor Image
Kevin Horan

Former Director, Fixed Income Indices

S&P Dow Jones Indices

Crude oil, as measured by the S&P GSCI All Crude was down 20% in July 2015 and has continued its sell-off in August 2015 by dropping another 6.86%.  As of Aug. 10, 2015, the index has returned -25.4% YTD.  Energy-related bonds in the investment-grade or high-yield indices have added a negative hit to the indices’ overall performance.

The energy sector of the S&P U.S. Issued Investment Grade Corporate Bond Index accounts for 8.6% of the index’s market value.  So far in August 2015, the sector has remained positive, returning 0.14%, almost offsetting July 2015’s -0.15% return.  June 2015 had a more significant negative performance with -2.05%.  The S&P U.S. Issued Investment Grade Corporate Bond Index has returned 0.16% MTD and -0.03% YTD.  The S&P 500® Energy Corporate Bond Index, a sub-index of the S&P 500 Bond Index that includes both investment-grade and high-yield issuers of the equity index, has returned -0.11% MTD and -0.72% YTD.

In the S&P U.S. Issued High Yield Corporate Bond Index, the energy sector has had more of an impact, as the market value weight of the sector is 14.4% of the index.  Already in August 2015, the energy sector is down 2.9%, following a 5.37% loss in July 2015 and a 3.31% loss in June 2015.  At the end of May 2015, the S&P U.S. Issued High Yield Corporate Bond Index had a YTD return as high as 4.08%, but it has returned 1.18% YTD.

Treasury yields, as measured by the S&P/BGCantor Current 10 Year U.S. Treasury Bond Index, moved 17 bps lower in July 2015.  The first week of August 2015 saw the yield-to-worst of the S&P/BGCantor Current 10 Year U.S. Treasury Bond Index close almost flat, after moving 12 bps higher on the release of stronger Factory Orders and ADP Employment numbers.  However, the increase in rates did not last long, as the yield-to-worst moved down 10 bps to close at 2.17%.  The index has returned 0.18% MTD and 1.57% YTD.  Market participants will return from their vacations in August 2015 to focus on September 2015 and the possibility of a Fed rate hike.

Exhibit 1: Index Values
Index Values


Source: S&P Dow Jones Indices LLC.  Data as of Aug. 7, 2015.  Past performance is no guarantee of future results.  Chart is provided for illustrative purposes.

The posts on this blog are opinions, not advice. Please read our Disclaimers.

OK Jobs Report Gives No Hint for the Fed

Contributor Image
David Blitzer

Former Managing Director and Chairman of the Index Committee

S&P Dow Jones Indices

Anyone hoping that this morning’s employment report would send a clear message to the markets and the Fed about the timing of a rate increase was sorely disappointed.  There is virtually no change from last month, even to the second decimal place on some lines. The charts show the unemployment rate — unchanged — and the rise in payrolls — a touch weaker — than in June.  One positive note, average hourly earnings rose 2.4% from July 2014, a bit stronger than last time. (from The Employment Situation Report, 8-7-15.) Click on chart for larger image.

Debate over whether the Fed will, or should, raise the Fed funds target centers around inflation, jobs and GDP.  Taken together these don’t make an clear case for higher interest rates. Unemployment is down, job growth is good but there could still be some slack in the labor markets given the lower participation rate. Inflation is still below the Fed’s target although it is closer than a year ago. GDP growth is not all that impressive.  All these  miss one point: the Fed would like to take real steps towards normal monetary policy and begin shrinking its balance sheet.  With favorable economic conditions, this may be time to move forward.

The odds for a Fed move in September remain a bit better than 50-50.   but we will have to wait for the next employment report on Friday September 4th for a better guess.

The posts on this blog are opinions, not advice. Please read our Disclaimers.

What Rising Rates Won’t Do

Contributor Image
Fei Mei Chan

Former Director, Core Product Management

S&P Dow Jones Indices

Here is a dramatic chart:

what rising rates won't do1

It provides a complete history of the trajectory of interest rates over the last sixty years—and also the backdrop for why there’s so much ado about rates today.  It also explains the consensus sentiment that there is only one direction for interest rates to head. We have no desire to enter the pervasive discourse around the timing and pace of the expected rise in interest rates.   But we can suggest three important things that will not happen when interest rates do rise.

First, rising rates won’t foretell the direction of the stock market, as the next chart illustrates.

what rising rates won't do2

Conventional wisdom is that rising interest rates are bad for equities. But in the last 25 years, the presumed relationship between equity performance and interest rates has been severely challenged.

Second, rising rates won’t foretell whether stock market dispersion will widen.  Dispersion is a measure of the degree to which the components of an index perform similarly.  If the components are tightly bunched, dispersion will be low and, other things equal, active managers will be challenged to add value by stock selection.

what rising rates won't do3

Dispersion rose in July, and may continue to do so.  But as the historical data show, there is no reliable relationship between changes in dispersion and changes in interest rates.

Finally, rising rates won’t foretell the performance of factor indices.  We examined several pairs of nominally opposite factor indices (e.g., growth vs. value, low volatility vs. high beta, etc.).  In no case is there reliable evidence that interest rate changes have an impact on the relative performance of factor indices.   The chart below highlights this for the S&P 500 Low Volatility and High Beta Indices.

what rising rates won't do4

There will no doubt be many economic and market effects attributed to the rise in interest rates, when it comes.  This trifecta serves as a good reminder that analyzing the behavior of the equity market involves more than just the Fed’s decrees.

The posts on this blog are opinions, not advice. Please read our Disclaimers.

Large Cap Funds: Active Versus Passive

Contributor Image
Todd Rosenbluth

Director of ETF and Mutual Fund Research

S&P Capital IQ Equity Research

In the first half of 2015, investors pulled $22 billion out of large-cap core U.S. equity mutual funds, but added $19 billion to S&P 500® Index-linked mutual funds. While this confirms that active management is losing share to passive, we think there are still strong active large-cap mutual funds to choose from.

According to S&P Dow Jones Indices, just 23% of all large-cap core active funds outperformed the S&P 500 Index in the three-year period ended 2014. (It is not possible to invest directly in an index, and index returns do not reflect expenses an investor would pay). On an equal-weighted basis, the average large-cap fund’s 18.6% three-year annualized return lagged the S&P 500 index by approximately 180 basis points. These performance challenges are not rare, as just twice in the past ten calendar years more than 50% of actively managed funds have beaten the “500”. A separate S&P Dow Jones study revealed how hard it is for those large-cap funds that outperformed to continue to do so. Indeed, just 4.5% of the outperformers in the 12-month period ended March 2011 maintained their top-half ranking in each of the four subsequent 12-month periods.

The S&P Dow Jones Indices studies highlight that you would be better off with an index-based large-cap offering than choosing an average active fund. In fact there are many below-average performers. For example, Davis New York Venture Fund (NYVTX) is among the biggest large-cap core funds, yet it lagged peers in four of the five last five calendar years. Indeed, NYVTX and its sister share classes had $2.8 billion of outflows in the first half of 2015.

Of course, nobody aims to invest in a below-average mutual fund.

S&P Capital IQ’s mutual fund rankings incorporate holdings-based analysis as well as a review of a fund’s relative track record and cost factors. We find 30 large-cap funds meet our criteria, though some of multiple share classes of the same portfolio.

The list of funds included American Century Equity Growth Fund (BEQGX), Fidelity Fund (FFIDX) and T Rowe Price Growth & Income Fund (PRGIX), Vanguard Growth & Income Fund (VNQPX).

S&P Capital IQ hosted a client webinar on active versus passive strategies on Tuesday, August 4, but you can listen to a replay http://t.co/4KDPwLW9Aj or email wealth@spcapitaliq.com. Reports on the aforementioned mutual funds and ETFs can be found on MarketScope Advisor.

Please follow me @ToddSPCAPIQ to keep up with the latest ETF Trends

—————————————————————————————————–
The views and opinions of any contributor not an employee of S&P Dow Jones Indices are his/her own and do not necessarily represent the views or opinions of S&P Dow Jones Indices or any of its affiliates.  Information from third party contributors is presented as provided and has not been edited.  S&P Dow Jones Indices LLC and its affiliates make no representations or warranties of any kind, express or implied, regarding the completeness, accuracy, reliability, suitability or availability of such information, including any products and services described herein, for any purpose.

The posts on this blog are opinions, not advice. Please read our Disclaimers.