
NASA’s series of stark, eye-opening satellite images, its “World of Change” project, reveals years of global change in just seconds, changes from weather, humans and natural phenomena that transform Earth’s landscape.
Take, for instance, the rapid deforestation of the Amazon Rainforest in Brazil’s Rondônia state during the 12-year period from 2000 to 2012. Slowly but surely the lush green of the area’s more than 80,000 square miles of forest quickly fades into taupe as deforestation claims more than 26,000 square miles of pristine forest. That’s a swath bigger than the state of West Virginia and one-tenth the size of Texas.
Some of the most recently updated images reveal how Arctic and Antarctic sea ice change seasonally and over time. In the Antarctic, the max sea ice happens in September, the minimum in February. “Since the start of regular satellite observations in 1979,” NASA writes, “total Antarctic sea ice has increased by about 1 percent per decade,” though the agency points out it’s hard to tell whether this is a sign of “meaningful change.” In the Arctic, the opposite is happening, with sea ice there in consistent decline.
These are just a few examples from NASA’s World of Change series. Below, 14 more, with animations of several of the sites. Click through the slideshow above to view each of these series.
1. Atchafalaya Bay, Gulf Coast
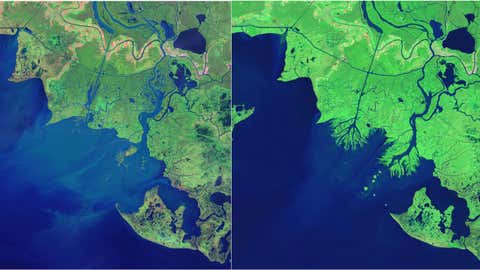
Though much of the Mississippi River Delta is disappearing at an alarming rate, in Atchafalaya Bay, two new deltas have emerged, built from sediment carried by the river. The changes from 1984, when the image on the left was taken, and 2014, when the image on the right was taken, are evident.
The Atchafalaya is what’s called a distributary (opposite of a tributary) of the Mississippi River, meaning it breaks from the main river and forms finger-like extensions — likely what you think of when you picture a delta. “Studies of the geologic history of the meandering Mississippi have shown that, if left to nature, most of the river’s water would eventually flow down the Atchafalaya,” NASA reports.
Structures put in place by the Army Corps of Engineers prevent this from happening, but even with the deterrents, the Atchafalaya has enough sediment to result in landforms like those seen above on the right, in the middle of the image.
2. Aral Sea
Pictures of the Aral Sea — once the world’s fourth largest lake — from the decade-and-a-half period from 2000 to 2014 tell a sad story.
In the 1960s, the then-Soviet Union diverted the Aral Sea’s two tributary rivers to irrigate the desert region surrounding the lake, according to a study from Columbia University. A large percentage of the water — between 25 and 75 percent, according to Columbia — was soaked up by the desert and wasted.
Almost immediately the lake began drying up. Before the diversions, the Aral Sea was roughly 26,000 square miles, but in recent years has shrunk by more than 90 percent, NASA reports. What little water remained became a concentrated mess of salt, fertilizers and other contaminants used to facilitate agriculture in surrounding areas. Wind kicked up the pollutants and choked surrounding communities with hazardous dust storms.
3. Amazon Deforestation, Brazil
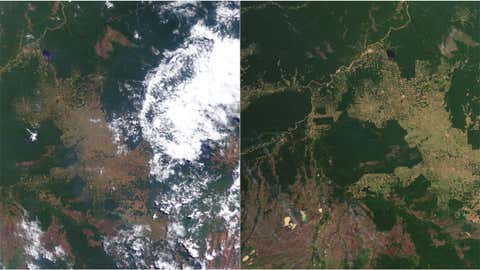
We already mentioned Amazon deforestation in the intro above. But these two photos (as well as those in the slideshow up top) reveal how the green, lush rainforests of the Amazon basin slowly retreat until just a thin swath remains. By the year 2003, more than 26,000 square miles of vegetation had been cleared, an area one-tenth the size of the state of Texas.
4. Alberta Oil Sands, Canada
Under Alberta, Canada, sit 170 billions of barrels of oil. Since 1984, the number of mines over these oil sands — so-called because of the substance bitumen, which covers the area’s sand — has grown slowly but exponentially, to tap into this oil reserve. As evidenced by the landscape changing above, the mines are invasive. Heavy duty construction equipment digs up 720,000 tons of sand each day, NASA notes, carving holes up to 260 feet deep into the Earth.
5. Cape Cod, Massachusetts
Unlike some of the other examples here, this animation shows Earth changing in an entirely natural way.
Coastal barriers, typically parallel to the mainland, protect our coastlines and often provide wildlife habitat. “Barrier beaches and spits are constantly raised up, shifted and torn down by the natural ebb and flow of waves, currents, winds and tides. Storms can reshape them abruptly and dramatically,” NASA explains.
Along Cape Cod, Mass., Chatham specifically, the barrier has shifted south along the coast constantly breaking up and forming new connections between the sandbars and islands that rest in the Atlantic Ocean — exactly what coastal barriers are meant to do.
Storms played a key role in transforming the coastal barrier shown above. A 1987 storm split what was known as “North Beach” into two, forming South Beach Island. Then, in 2007, another storm wreaked havoc on North Beach, cutting out a slice of the northern expanse that turned “North Beach” into “North Beach Island.” By 2013, another storm sliced up South Beach Island, and the process continues today.
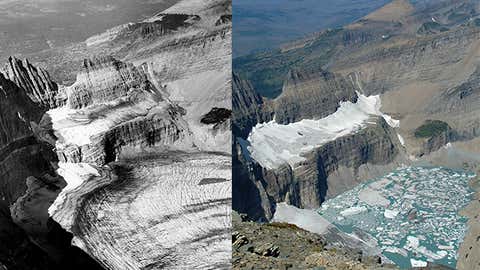
6. Columbia Glacier, Alaska
The Columbia Glacier, one of the fastest-changing glaciers in the world, according to NASA, retreated from its original spot at the northern tip of Heather Island, Alaska. This animation made from false-color images reveals the dramatic movement of this monstrous glacier from July 29, 1986, to July 2, 2014.
Here’s the backstory: In 1980, Columbia Glacier jutted out far enough to reach Heather Island in Columbia Bay. From 1986 to 2002 the glacier slowly disappeared from Columbia Bay. Then it started rapidly retreating, and by September 2003 only empty ocean water remained in a space once completely occupied by glacier. Chunks of ice broke off and flooded the bay with icebergs in 2008, once again filling that part of Columbia Bay with ice.
By 2014, the glacier had retreated more than 12 miles inland and the ice had lost nearly half of its thickness and volume, NASA reports. The glacier is expected to reach the shoreline by 2030.
7. Beachfront, Dubai, United Arab Emirates
How do you expand a beachfront when there’s no new natural land? Create it. In Dubai, United Arab Emirates, designers engineered hundreds of artificial islands by scooping up sand from the ocean floor.
In Dubai, construction crews morphed a desert wasteland into a global destination. Some of those construction projects are seen in the animation above, which shows the urbanization of Dubai from November 2000 to April 2011, including one that involved dredging up sand from the bottom of the Persian Gulf to piece together a collection of artificial islands in the shape of a palm tree.
Colors play an important part in the animation, which uses false-color satellite images. Red represents vegetation, water is dark blue, empty ground is brown and the many skyscrapers and buildings erected on the site are colored gray or light blue. By the end of the animation the landscape looks nothing like it once did, with arid land replaced by a complex network of structures, roads and irrigated vegetation.
8. Etosha National Park, Namibia
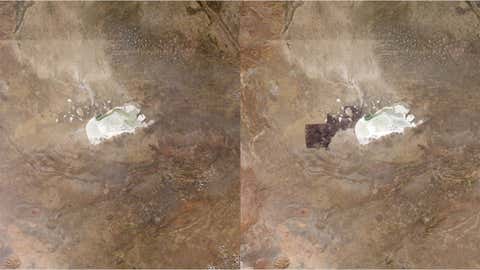
Rhinos, elephants and lions all call Namibia’s Etosha National Park home. For the health of ecosystems in the park a fire every once in awhile turned out to be a good thing — a challenging concept to get park managers and others to believe.
That’s not surprising, given that a 2011 fire burned out of control, destroying more than 900,000 acres and killing seven elephants, plus 50 giraffes and 30 rhino. Those in charge of the park learned a great deal from that fire, and the controlled burn in 2012 (shown in these two images and in the slideshow above) spread as it was supposed to, was extinguished easily and didn’t kill any animals.
9. Hobet Mine, West Virginia
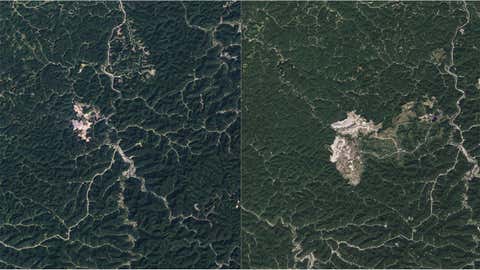
Mountaintop mining is just what it sounds like. To get to the coal below the Appalachian Mountains, say, companies literally remove the tops of the mountains. The aftermath is a “towering earthen dam called a valley fill,” NASA writes, which harms the quality of any nearby water bodies.
U.S. Geological Survey research published in 2014 in the journal Freshwater Science revealed just how bad the aftereffects could get: “Appalachian streams impacted by mountaintop mining have less than half as many fish species and about a third as many fish as non-impacted streams,” notes a release about the study. Populations of stream insects have also been damaged.
In 1984, the Hobet mine, pictured above, was limited in scope and location. Then the operation expanded to the southwest and eventually to the north. By 1992, the area’s topography had changed, the valley fills evident from satellites.
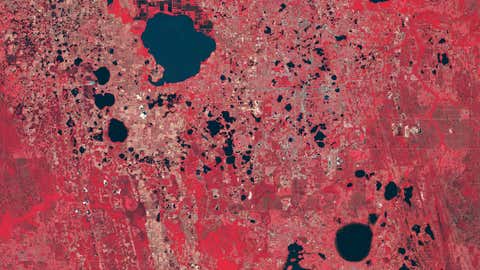
10. Lake Powell, Utah
Prolonged drought has caused water levels in Utah’s Lake Powell to drop dramatically. At the animation’s start the lake’s waters are high, its colors blue. As it progresses, side canyons start to appear, eventually exposing a pale outline around the lake’s perimeter. In the final image, Lake Powell is at just 42 percent capacity.
11. Lake Tahoe
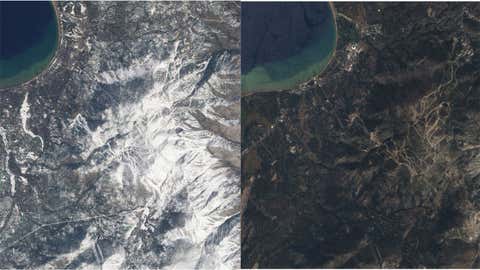
Seasonal changes in Lake Tahoe, possibly best known for its outdoor activities during nearly every season, can be dramatic. In this pair of images of Lake Tahoe, watch the seasons change as summer turns to winter, as snow comes and goes, as the color of the water changes based on sediment material and levels. The images in the slideshow run from Aug. 27, 2009, through Sept. 7, 2010.
12. Howland and West Enfield, Maine

In another set of watch-the-seasons-change images, these two pictures (and those in the slideshow above) showcase the small Maine towns of Howland and West Enfield from April 14, 2008, through Dec. 18, 2008. The greenery remains (mostly) green all the way to the end of the year.
13. Yellow River, China

China’s Yellow River is one of the longest on the planet and, according to NASA, has the most sediment of any river on Earth. So when that sediment changes, it’s very visible, especially from above. “The soil is easily eroded, and millions of tons of it are carried away by the river every year,” writes NASA. “Some of it reaches the river’s mouth, where it builds and rebuilds the delta.”
14. Yellowstone National Park

This is one view of Yellowstone National Park you may have never before seen: From above.
In 1988, massive wildfires struck the park, caused by both lightning and humans. When all was said and done, almost 800,000 acres burned — 35 percent of the park. Even 23 years later, in 2011, the park was still recovering, as seen in the image on the right, from September of that year. The fires left visible scars that could potentially mar the landscape forever.
MORE ON WEATHER.COM: Glaciers in Retreat