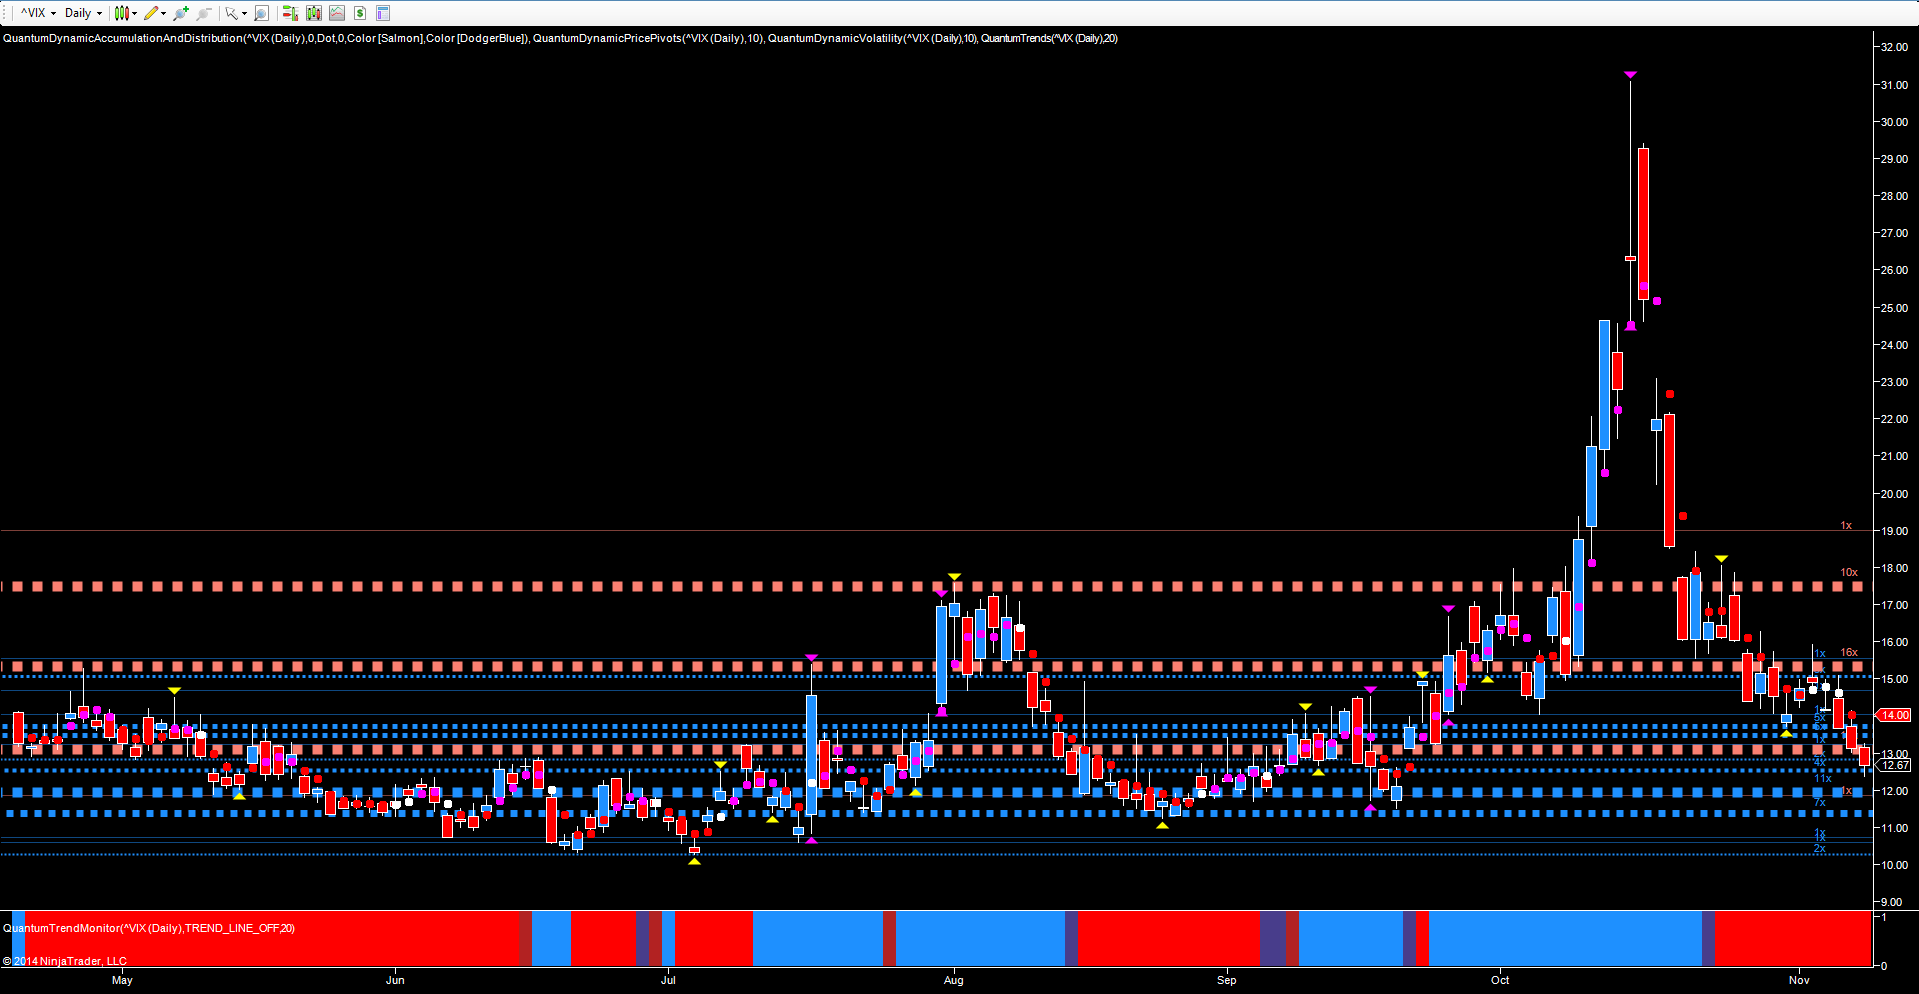
As equity markets continue to climb ever higher and breaking out into new high ground, it is the VIX which is moving at the same speed in the opposite direction, as fear is replaced with complacency with the sun shining again as risk appetite returns to the markets. For the VIX it’s been a roller coaster ride following the sharp reversal of mid October, which saw the index touch an intraday high of 31.06 before closing on the 15th October with a long legged doji candle, signaling potential market indecision, with the candle of the 16th October then confirming this with an inside day.
Since then the index has declined steadily, first to test the potential platform of support in the 17.60 region which was duly breached following a period of congestion, and subsequently moving lower again, this time to test the lower level of support in the 15.25 area. This was breached in trading last week with a further deeper move to test the deep areas of support now in place below, and built up over the extended congestion phases of the last few months. Yesterday’s trading session broke below one of these key levels in the 13.00 region, with the index closing at 12.67 on the daily chart as equity markets continue to climb. The next deep area of accumulation now awaits in the 12.00 area, and any move through here could see the 11.40 level tested, then opening the way to a test of the 10.20 region last see in July. From there, it’s a short hop down into single figures, and with the year end approaching fast and the Santa Claus rally now building momentum, it’s likely to be a very happy Christmas for equity traders and investors as the bull run continues, with the VIX leading the way.
As always there will be a huge determination to hold on to this feel good factor so that the year can end on a high note as we trade at 52 week highs. However, the start of 2015 could present a very different picture, and it would be no surprise to see a further correction in the New Year, once the year end bonuses have been paid, and traders return for the next 12 month campaign. For volume traders, it’s a question of applying volume price analysis to determine the validity of any further corrections. The last one was just that – the next could well be the selling climax that many believe is waiting in the wings.
