The CBOE changed the way the VIX® was calculated on October 6th, 2014—asserting the change would provide a more accurate assessment of expected volatility. The new process does look better to me, but I’ve been surprised that the new VIX and the old VIX (listed as VIXMO) sometimes differ by as much as plus/minus 10 percent.
Disagreements between the two indexes are not due to only one factor, but clearly one improvement was to eliminate the week of the month where the VIX was calculated using extrapolation.
The VIX provides a 30 day estimate of volatility, but the S&P 500 options (SPX) used in the VIX calculation have fixed expiration dates. The CBOE transforms the options’ data into the VIX by using volatility specific interpolation / extrapolation. For example, if you have a volatility number for options that expire in 10 days and another for options that expire in 38 days you can reasonably assume that the VIX level should be between those two numbers.
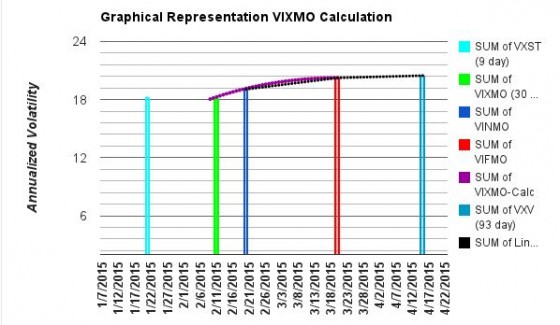
One requirement with the old VIX calculation was that it couldn’t use options with less than 7 days to expire. When the 7 day restriction was reached the calculation switched to using options that had more than 30 and 58 days until expiration. The chart below shows the calculation right after that switch on January 12th, 2015.

Normally this extrapolation was reasonable, but if the market is nervous the shorter term volatility values climb. January 12th, 2015 was a case in point—notice how the light blue VXST bar (9 day volatility) is higher than the VIX estimate.The blue and red bars are the volatility numbers (VINMO & VIFMO) from the S&P options and the green bar is the VIX calculation extrapolated from those two numbers. For details on that process see: Calculating the VIX Index—the Easy part
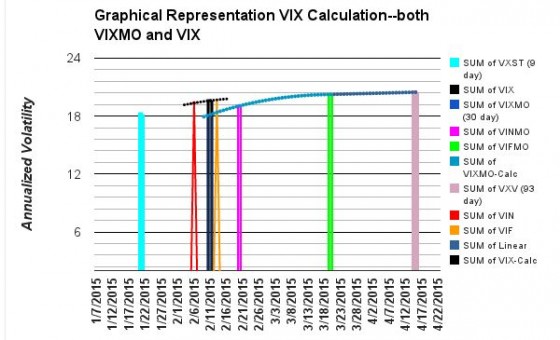
The next chart shows the new and old VIX calculations together. The black dotted line shows the interpolation used for the new VIX calculation; the blue dotted line shows the old VIX extrapolation. The black vertical bar shows the VIX estimate.

The CBOE’s new calculation always uses options that expire within a week of the VIX’s 30 days. The red and orange triangles show their values on January 12th.
Clearly the two calculations have a major difference of opinion —the new calculation’s result is 7.5% higher (19.60 vs. 18.15).
The old VIX calculation misses the fact that the shorter term volatility has ramped up.
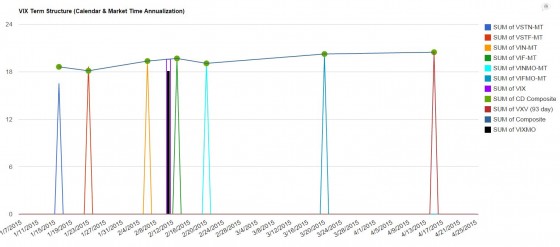
The CBOE provides VIX style calculations on six different sets of options used in their VIX, VIXMO, and VXST calculations. These calculations don’t need time extrapolations / interpolations so that source of potential errors is eliminated. The chart below shows how they mapped out on January 12th, 2015 (click image to enlarge).

In this case the new VIX calculation is more accurate, cleanly mapping into the overall volatility term structure.
The green dots on the top line represent the CBOE VIX style volatilities over time. The vertical black bar shows the old VIX calculation and the purple outline above it shows the new VIX calculation.
