During my typical S&P 500 update, I tend to focus on technical support and resistance levels to watch. But rather than focusing on key price levels, I’d like to focus on the S&P 500’s relationship with the Volatility Index (VIX) and what it may be saying (I’ll cover some levels to watch at the end).
The VIX has long been followed as a fear index, gauging whether or not investors are fearful (buying puts), which shows up in a higher VIX, or comfortable, which shows up in a lower VIX. Typically, a VIX above 20 is a near-term sign of elevated risk and volatility, while a move above 30 typically signals a stock market correction and extreme volatility (potentially crash-like conditions – think 2001-2002 or 2008-2009).
What’s interesting is that since 2009, we have seen major selloffs in 2010 and 2011, but volatility spikes have faded (for the most part) in strength and duration. This doesn’t appear to be out of the ordinary, as it is a sign of a bull market. But when taken into the context of recent global events, including slowing-or-no-growth out of Japan, Europe, China, and Russia, followed by a collapse in the Euro and Crude Oil, it’s pretty amazing that the recent VIX spike over 30 in October only brought about a pullback of 9.8% (intraday).
See the chart below showing VIX spikes over 20 since 2011. I included another fear index, the Equity Put-Call Ratio for context.
SPX vs VIX vs Equity Put-Call – Since 2011
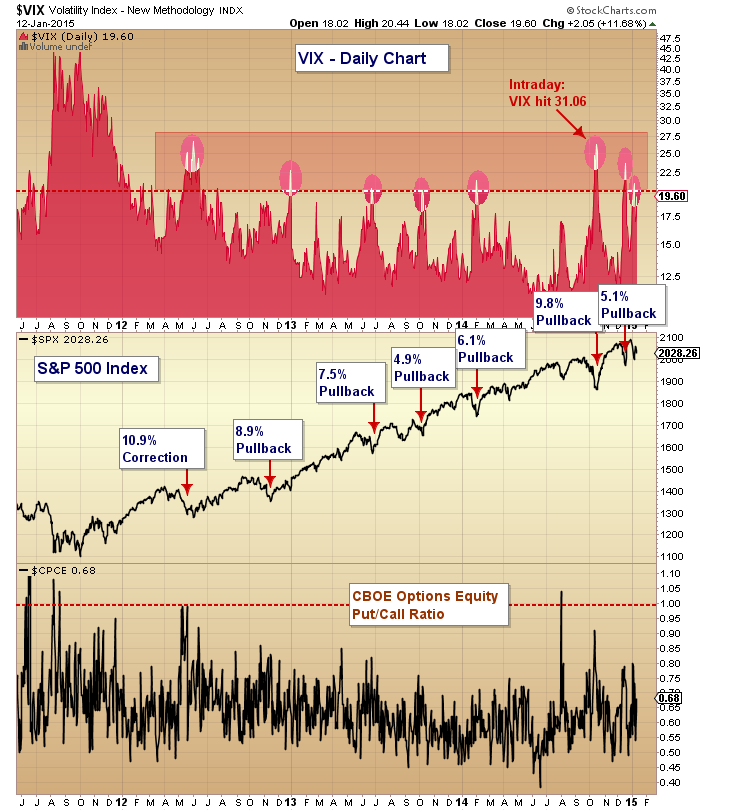
From a macro context, this is a sign that equities (and precisely U.S. Equities) continue to be in high demand. This makes sense when coupled with the stronger U.S. Dollar. Big gains in 2015 seem like a tall feat, but we’ll take it day by day and week by week moving forward.
From a near-term view, the chart shows three VIX spikes over 20 in the past 3 months. And the close on the VIX today was 19.60, so perhaps the uptick in volatility isn’t over just yet. In fact, I’m thinking that the markets may see a bit more volatility in 2015, especially if the past 3 months is a sign. But how much will it matter to U.S. equity prices? Whether we get that crash that many are calling for remains to be seen, but it seems a ways away as we sit just 3 percent off all-time highs with a VIX at 20.
S&P 500 Technical Support And Resistance Levels
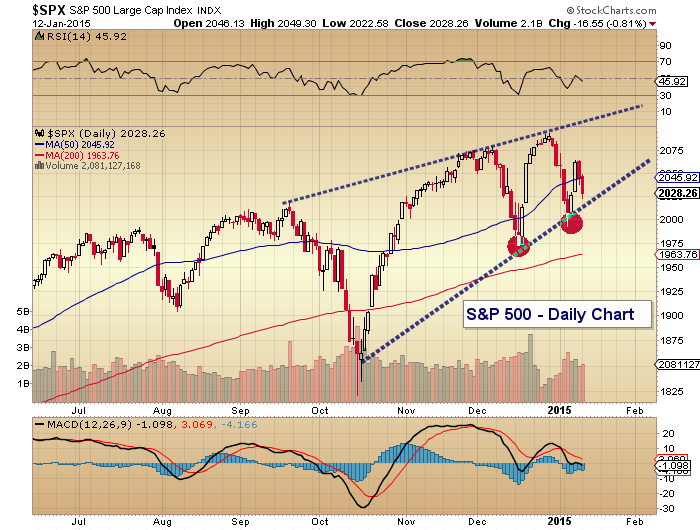
I only have one chart to share regarding the current construct of the S&P 500 and it highlights a rising wedge pattern. It’s still early and loose, so it may simply be used as lower and upper channel support/resistance for now. The lower end comes in around 2010. The takeaway: Any move below the lower support would indicate a retest of the January lows (1992.44). And any breach of that level would be a caution flag, as it would quickly call attention to the December lows at (1972.56). A loss of that support level would quickly put the index on its heels and in the the bears hands. If the S&P 500 can remain above 2010, it will likely chop higher within the wedge. And if 2010 fails and the index finds support above the January lows, then a choppy, rangebound market might be in play.
S&P 500 Daily Chart
Thanks for reading.
Follow Andy on Twitter: @andrewnyquist
No position in any of the mentioned securities at the time of publication. Any opinions expressed herein are solely those of the author, and do not in any way represent the views or opinions of any other person or entity.


