Oil and rig counts

Simply sign up to the Oil myFT Digest -- delivered directly to your inbox.
The weekly US rig count data, published on Friday, have generated considerable excitement in the oil markets recently, with the numbers released by oil-services group Baker Hughes moving crude prices.
What’s going on?
The numbers identify the level of drilling activity and have traditionally been regarded as a gauge for the health of the US oil industry. They have come under the spotlight since the oil markets have tanked and traders and investors try to figure out what low prices mean for US shale production. The latest figures showed that oil rigs have fallen 24 per cent from the recent peak of 1,609 in October last year. Last Friday’s figures were particularly stark, with 7.1 per cent of all US rigs idled in one week.
OK, but what is a rig, exactly?
These are not the big oil platforms in the North Sea or the Gulf of Mexico. They are used to drill wells, from where the oil is extracted. After the drilling is completed, a rig will be moved off site and the well topped by a wellhead. So rig count reflects exploration and development of oil and gas wells rather than actual production.
But is it still a leading indicator of what’s about to happen to the oil and gas sector?
The data are a good benchmark of the health of exploration and production companies, as well as the oil-services groups. And yes, they give you some direction of oil production.
But be warned, not all rigs are the same. Technological advances in drilling mean that all sorts of productivity increases have been made over the past few years and that you need to look below the headline numbers. For example, horizontal drilling, along with hydraulic fracturing, or “fracking”, has led to big output increases in shale oil and gas production. But rig count numbers show the number of rigs drilling horizontal wells has not fallen as much as other conventional rigs.
What do you mean by horizontal drilling?

A rig drills down to the layer of oil or gas-producing rock formation. Compared to a vertical well, whose access to the oil-producing rock is limited, with a horizontal well, the drill makes a turn into the layer. The technology has enabled more production and its evolution continues.
So far, the numbers of rigs that are drilling vertical and directional (those dug at slight angles) wells have fallen faster than that of horizontal ones. Morgan Stanley says that since mid-October oil rigs drilling horizontal wells have fallen only 16 per cent, compared with 41 per cent for vertical and directional. The bank also points out that most of the rig-count falls have been in regions that are less productive than others.
Then should we be looking at rig counts at all?

Yes, but do handle the data with care as the correlation between rig count and production has become increasingly less straightforward.
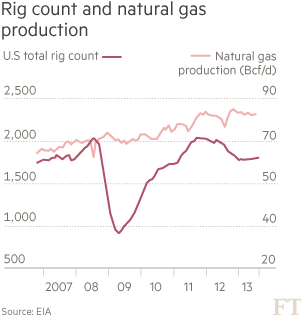
Some analysts point to the natural gas example, where US rig counts started to fall in 2009 but production failed to decline as much. With drilling technology continuing to advance leading to more production efficiency, output may not fall as much as the headline rig count suggests. In fact, Citigroup forecasts that without a “sizeable” cut in rig counts at the leading shale regions, Bakken, Eagle Ford and Permian, production could still continue to rise.
This article is part of an online series on commodities made easy
This article has been amended to clarify the types of wells
Further reading:
Crude climbs as oil majors cut spending
Sharp drop in US rigs drilling for oil
Could record slide in crude oil price be ending?
Also read:
Commodities explained: Cost curves
Commodities explained: The price-supply disconnect
Commodities explained: Qingdao
Commodities explained: Contango
Comments