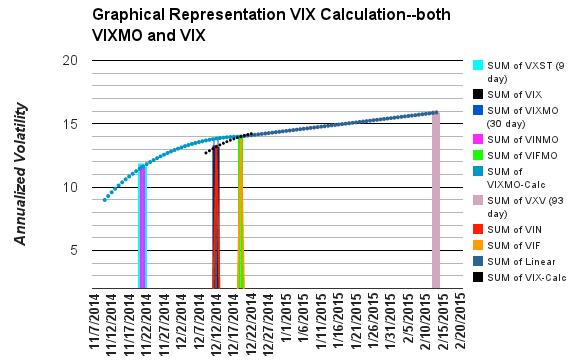
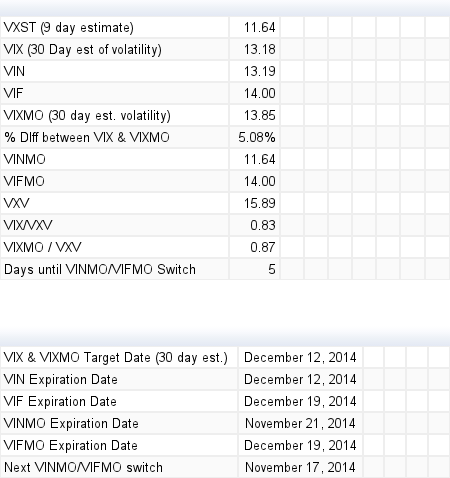
The chart below graphically represents the calculation for the VIX® and the legacy VIX (ticker VIXMO), which was used from September 22, 2003 through October 5, 2014. The actual VIX is located on the black dotted line in the left center of the graph. Click here for a larger snapshot for 12-Nov-2014. The VIX now uses an interpolation between two VIX-style calculations (VIN and VIF) on SPX options series that are a week apart -- bracketing the 30-day target horizon of the VIX. The legacy calculation uses SPX monthly options (now published as VINMO and VIFMO), which requires significantly longer interpolation/extrapolation periods.


Since its inception on October 6, 2014 the new VIX has often differed significantly from the older calculation, often running 5% or more lower than the legacy number. This is disconcerting and I initially wondered if the reduced volume/open interest of the SPX weekly options used in the new calculation or some other factor was distorting things, but as I look at the data I’m becoming comfortable with the new calculation as a significant improvement in the accuracy of the index.
The VXST is the CBOE’s 9 day version of the VIX, and VXV is the CBOE’s 93 day version.
There are two somewhat parallel markets associated with general USA market volatility: the S&P 500 (SPX) options market and the VIX Futures market. SPX option prices are used to calculate the CBOE’s family of volatility indexes, with the VIX® being the flagship. VIX futures are priced directly in expected volatility for contracts expiring up to 9 months out. The nearest VIX Future synchronizes with the VIX once a month -- on its expiration date.
Additional resources:
- VIX Futures’ timescape and historical data: VIX Central
- VIX style indexes and term structure for SPX option expirations up to 2½ years out: CBOE
- The Volatility Watcher’s Toolkit
- Trading VIX Options
The dynamically updated chart above uses delayed quotes from Yahoo Finance. For more information on these VIX calculations see Calculating the VIX and Calculating the VIXMO.
